55 8.3 Factors Influencing Production
For terrestrial plants, many factors affect productivity, including light, temperature, nutrients, soil, and water. For phytoplankton, soil is obviously not needed, and water availability is not an issue. Temperature is generally more stable in the ocean than on land, so for phytoplankton, productivity comes down to the availability of light and nutrients.
Light
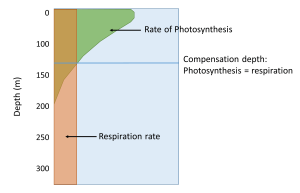
Since light is vital for photosynthesis, phytoplankton and other primary producers are limited to the uppermost layers of the ocean where light is abundant enough to sustain the reaction. As depth increases, light intensity decreases until there reaches a depth where photosynthesis can no longer occur (Figure 8.3.1). The region through which sufficient light for photosynthesis can penetrate is called the photic or euphotic zone, which extends down to about 200 m (section 6.5).
In addition to undergoing photosynthesis, phytoplankton also respire, consuming some of the organic compounds they produce. Rates of respiration are not light dependent, and respiration occurs at all depths and light levels. Therefore, as depth increases the rate of photosynthesis declines as light is diminished, until a point is reached where the rate of photosynthesis equals the respiration rate (Figure 8.3.1). This depth is the compensation depth, and it marks the lower level of the photic zone, and represents the depth where net primary production ends. Below this depth, there is net respiration.
Nutrients
Nutrients are required by all of the marine primary producers. The major nutrients required by phytoplankton are nitrogen and phosphorus, in the forms of nitrate NO3–, nitrite NO22-, ammonium NH4+, and phosphate PO43-. Many phytoplankton, particularly the diatoms, also require silica, SiO2, for shell formation. All of these nutrients occur in very small amounts in seawater, so they are often the limiting factors for phytoplankton growth in most situations, particularly the nitrogen compounds. For example, agricultural soil contains 0.5% nitrogen in the upper meter of soil, while surface ocean water contains about 0.00005% nitrogen, 1/10,000 the amount in soil.
As we saw in section 9.6, nutrients are not distributed evenly throughout the water column (Figure 8.3.2). Near the surface nutrients are quickly utilized by phytoplankton as they become available, so surface waters are nutrient-poor. But as the phytoplankton are consumed or die they are recycled into particles of organic matter, such as fecal pellets or carcasses, that sink into deeper water. Once in deep water, decomposition of these materials releases the nutrients back into the water column. Because there are no producers to utilize them at depth, nutrients are more abundant in deeper water.
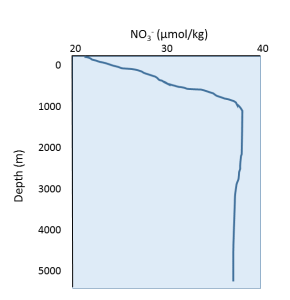
These deep water nutrients are out of reach of the phytoplankton at the surface. The thermocline and density stratification of the water column generally prevents the nutrient-rich deep water from mixing with the surface water. However, under certain conditions this nutrient-rich deep water may be brought to the surface through the process of upwelling (see section 9.5). Where upwelling occurs there is usually high productivity as the phytoplankton can take advantage of the input of nutrients.
By Paul Webb, used under a CC-BY 4.0 international license. Download this book for free at https://rwu.pressbooks.pub/webboceanography/front-matter/preface/
Estuaries are partially enclosed bodies of water where the salt water is diluted by fresh water input from land, creating brackish water with a salinity somewhere between fresh water and normal seawater. Estuaries include many bays, inlets, and sounds, and are often subject to large temperature and salinity variations due to their enclosed nature and smaller size compared to the open ocean.
Estuaries can be classified geologically into four basic categories based on their method of origin. In all cases they are a result of rising sea level over the last 18,000 years, beginning with the end of the last ice age; a period that has seen a rise of about 130 m. The rise in sea level has flooded coastal areas that were previously above water, and prevented the estuaries from being filled in by all of the sediments that have been emptied into them.
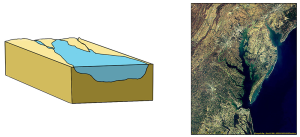
The first type is a coastal plain estuary, or drowned river valley. These estuaries are formed as sea level rises and floods an existing river valley, mixing salt and fresh water to create the brackish conditions where the river meets the sea. These types of estuaries are common along the east coast of the United States, including major bodies such as the Chesapeake Bay, Delaware Bay, and Narragansett Bay (Figure 4.6.1). Coastal plain estuaries are usually shallow, and since there is a lot of sediment input from the rivers, there are often a number of depositional features associated with them such as spits and barrier islands.
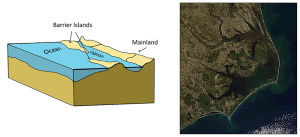
The presence of sand bars, spits, and barrier islands can lead to bar-built estuaries, where a barrier is created between the mainland and the ocean. The water that remains inside the sand bar is cut off from complete mixing with the ocean, and receives freshwater input from the mainland, creating estuarine conditions (Figure 4.6.2).
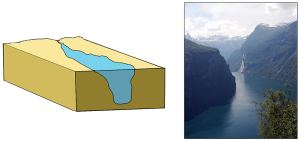
Fjords are estuaries formed in deep, U-shaped basins that were carved out by advancing glaciers. When the glaciers melted and retreated, sea level rose and filled these troughs, creating deep, steep-walled fjords (Figure 4.6.3). Fjords are common in Norway, Alaska, Canada, and New Zealand, where there are mountainous coastlines once covered by glaciers.
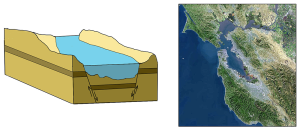
Tectonic estuaries are the result of tectonic movements, where faulting causes some sections of the crust to subside, and those lower elevation sections then get flooded with seawater. San Francisco Bay is an example of a tectonic estuary (Figure 4.6.4).
Estuaries are also classified based on their salinity and mixing patterns. The amount of mixing of fresh and salt water in an estuary depends on the rate at which fresh water enters the head of the estuary from river input, and the amount of seawater that enters the estuary mouth as a result of tidal movements. The input of fresh water is reflected in the flushing time of the estuary. This refers to the time it would take for the in-flowing fresh water to completely replace all the fresh water currently in the estuary. Seawater input is measured by the tidal volume, or tidal prism, which is the average volume of sea water entering and leaving the estuary during each tidal cycle. In other words, it is the volume difference between high and low tides. The interaction between the flushing time, tidal volume, and the shape of the estuary will determine the extent and type of water mixing within the estuary.
In a vertically mixed, or well-mixed estuary there is complete mixing of fresh and salt water from the surface to the bottom. In a particular location the salinity is constant at all depths, but across the estuary the salinity is lowest at the head where the fresh water enters, and is highest at the mouth, where the seawater comes in. This type of salinity profile usually occurs in shallower estuaries, where the shallow depths allow complete mixing from the surface to the bottom.
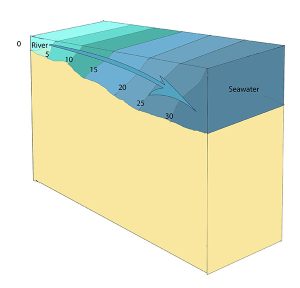
Slightly stratified or partially mixed estuaries have similar salinity profiles to vertically mixed estuaries, where salinity increases from the head to the mouth, but there is also a slight increase in salinity with depth at any point. This usually occurs in deeper estuaries than those that are well-mixed, where waves and currents mix the surface water, but the mixing may not extend all the way to the bottom.
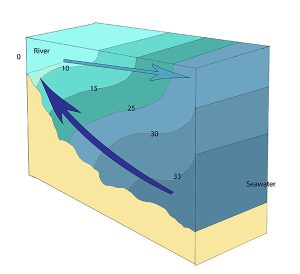
A salt wedge estuary occurs where the outflow of fresh water is strong enough to prevent the denser ocean water to enter through the surface, and where the estuary is deep enough that surface waves and turbulence have little mixing effect on the deeper water. Fresh water flows out along surface, salt water flows in at depth, creating a wedge shaped lens of seawater moving along the bottom. The surface water may remain mostly fresh throughout the estuary if there is no mixing, or it can become brackish depending on the level of mixing that occurs.
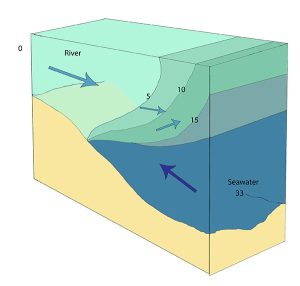
Highly stratified profiles are found in very deep estuaries, such as in fjords. Because of the depth, mixing of fresh and salt water only occurs near the surface, so in the upper layers salinity increases from the head to the mouth, but the deeper water is of standard ocean salinity.

Estuaries are very important commercially, as they are home to the majority of the world’s metropolitan areas, they serve as ports for industrial activity, and a large percentage of the world's population lives near estuaries. Estuaries are also very important biologically, especially in their role as the breeding grounds for many species of fish, birds, and invertebrates.
By Paul Webb, used under a CC-BY 4.0 international license. Download this book for free at https://rwu.pressbooks.pub/webboceanography/front-matter/preface/
Estuaries are partially enclosed bodies of water where the salt water is diluted by fresh water input from land, creating brackish water with a salinity somewhere between fresh water and normal seawater. Estuaries include many bays, inlets, and sounds, and are often subject to large temperature and salinity variations due to their enclosed nature and smaller size compared to the open ocean.
Estuaries can be classified geologically into four basic categories based on their method of origin. In all cases they are a result of rising sea level over the last 18,000 years, beginning with the end of the last ice age; a period that has seen a rise of about 130 m. The rise in sea level has flooded coastal areas that were previously above water, and prevented the estuaries from being filled in by all of the sediments that have been emptied into them.
The first type is a coastal plain estuary, or drowned river valley. These estuaries are formed as sea level rises and floods an existing river valley, mixing salt and fresh water to create the brackish conditions where the river meets the sea. These types of estuaries are common along the east coast of the United States, including major bodies such as the Chesapeake Bay, Delaware Bay, and Narragansett Bay (Figure 4.6.1). Coastal plain estuaries are usually shallow, and since there is a lot of sediment input from the rivers, there are often a number of depositional features associated with them such as spits and barrier islands.

The presence of sand bars, spits, and barrier islands can lead to bar-built estuaries, where a barrier is created between the mainland and the ocean. The water that remains inside the sand bar is cut off from complete mixing with the ocean, and receives freshwater input from the mainland, creating estuarine conditions (Figure 4.6.2).

Fjords are estuaries formed in deep, U-shaped basins that were carved out by advancing glaciers. When the glaciers melted and retreated, sea level rose and filled these troughs, creating deep, steep-walled fjords (Figure 4.6.3). Fjords are common in Norway, Alaska, Canada, and New Zealand, where there are mountainous coastlines once covered by glaciers.

Tectonic estuaries are the result of tectonic movements, where faulting causes some sections of the crust to subside, and those lower elevation sections then get flooded with seawater. San Francisco Bay is an example of a tectonic estuary (Figure 4.6.4).

Estuaries are also classified based on their salinity and mixing patterns. The amount of mixing of fresh and salt water in an estuary depends on the rate at which fresh water enters the head of the estuary from river input, and the amount of seawater that enters the estuary mouth as a result of tidal movements. The input of fresh water is reflected in the flushing time of the estuary. This refers to the time it would take for the in-flowing fresh water to completely replace all the fresh water currently in the estuary. Seawater input is measured by the tidal volume, or tidal prism, which is the average volume of sea water entering and leaving the estuary during each tidal cycle. In other words, it is the volume difference between high and low tides. The interaction between the flushing time, tidal volume, and the shape of the estuary will determine the extent and type of water mixing within the estuary.
In a vertically mixed, or well-mixed estuary there is complete mixing of fresh and salt water from the surface to the bottom. In a particular location the salinity is constant at all depths, but across the estuary the salinity is lowest at the head where the fresh water enters, and is highest at the mouth, where the seawater comes in. This type of salinity profile usually occurs in shallower estuaries, where the shallow depths allow complete mixing from the surface to the bottom.

Slightly stratified or partially mixed estuaries have similar salinity profiles to vertically mixed estuaries, where salinity increases from the head to the mouth, but there is also a slight increase in salinity with depth at any point. This usually occurs in deeper estuaries than those that are well-mixed, where waves and currents mix the surface water, but the mixing may not extend all the way to the bottom.

A salt wedge estuary occurs where the outflow of fresh water is strong enough to prevent the denser ocean water to enter through the surface, and where the estuary is deep enough that surface waves and turbulence have little mixing effect on the deeper water. Fresh water flows out along surface, salt water flows in at depth, creating a wedge shaped lens of seawater moving along the bottom. The surface water may remain mostly fresh throughout the estuary if there is no mixing, or it can become brackish depending on the level of mixing that occurs.

Highly stratified profiles are found in very deep estuaries, such as in fjords. Because of the depth, mixing of fresh and salt water only occurs near the surface, so in the upper layers salinity increases from the head to the mouth, but the deeper water is of standard ocean salinity.

Estuaries are very important commercially, as they are home to the majority of the world’s metropolitan areas, they serve as ports for industrial activity, and a large percentage of the world's population lives near estuaries. Estuaries are also very important biologically, especially in their role as the breeding grounds for many species of fish, birds, and invertebrates.
By Paul Webb, used under a CC-BY 4.0 international license. Download this book for free at https://rwu.pressbooks.pub/webboceanography/front-matter/preface/
Waves generally begin as a disturbance of some kind, and the energy of that disturbance gets propagated in the form of waves. We are most familiar with the kind of waves that break on shore, or rock a boat at sea, but there are many other types of waves that are important to oceanography:
- Internal waves form at the boundaries of water masses of different densities (i.e. at a pycnocline), and propagate at depth. These generally move more slowly than surface waves, and can be much larger, with heights exceeding 100 m. However, the height of the deep wave would be unnoticeable at the surface.
- Tidal waves are due to the movement of the tides. What we think of as tides are basically enormously long waves with a wavelength that may span half the globe (see section 4.1). Tidal waves are not related to tsunamis, so don’t confuse the two.
- Tsunamis are large waves created as a result of earthquakes or other seismic disturbances. They are also called seismic sea waves (section 3.4).
- Splash waves are formed when something falls into the ocean and creates a splash. The giant wave in Lituya Bay that was described in the introduction to this chapter was a splash wave.
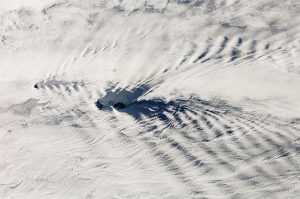
- Atmospheric waves form in the sky at the boundary between air masses of different densities. These often create ripple effects in the clouds (Figure 3.1.1).
There are several components to a basic wave (Figure 3.1.2):
- Still water level: where the water surface would be if there were no waves present and the sea was completely calm.
- Crest: the highest point of the wave.
- Trough: the lowest point of the wave.
- Wave height: the distance between the crest and the trough.
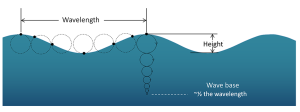
- Wavelength: the distance between two identical points on successive waves, for example crest to crest, or trough to trough.
- Wave steepness: the ratio of wave height to length (H/L). If this ratio exceeds 1/7 (i.e. height exceeds 1/7 of the wavelength) the wave gets too steep, and will break.

There are also a number of terms used to describe wave motion:
- Period: the time it takes for two successive crests to pass a given point.
- Frequency: the number of waves passing a point in a given amount of time, usually expressed as waves per second. This is the inverse of the period.
- Speed: how fast the wave travels, or the distance traveled per unit of time. This is also called celerity (c), where
c = wavelength x frequency
Therefore, the longer the wavelength, the faster the wave.
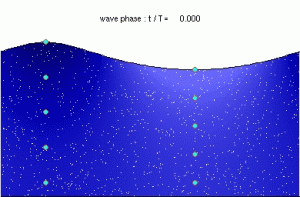
Although waves can travel over great distances, the water itself shows little horizontal movement; it is the energy of the wave that is being transmitted, not the water. Instead, the water particles move in circular orbits, with the size of the orbit equal to the wave height (Figure 3.1.3). This orbital motion occurs because water waves contain components of both longitudinal (side to side) and transverse (up and down) waves, leading to circular motion. As a wave passes, water moves forwards and up over the wave crests, then down and backwards into the troughs, so there is little horizontal movement. This is evident if you have ever watched an object such as a seabird floating at the surface. The bird bobs up and down as the wave pass underneath it; it does not get carried horizontally by a single wave crest.
The circular orbital motion declines with depth as the wave has less impact on deeper water and the diameter of the circles is reduced. Eventually at some depth there is no more circular movement and the water is unaffected by surface wave action. This depth is the wave base and is equivalent to half of the wavelength (Figure 3.1.4). Since most ocean waves have wavelengths of less than a few hundred meters, most of the deeper ocean is unaffected by surface waves, so even in the strongest storms marine life or submarines can avoid heavy waves by submerging below the wave base.

When the water below a wave is deeper than the wave base (deeper than half of the wavelength), those waves are called deep water waves. Most open ocean waves are deep water waves. Since the water is deeper than the wave base, deep water waves experience no interference from the bottom, so their speed only depends on the wavelength:
[latex]\text{speed (m/s)} = \sqrt{\frac{gL}{2\pi}}[/latex]
where g is gravity and L is wavelength in meters. Since g and π are constants, this can be simplified to:
[latex]\text{speed (m/s)} = 1.25\sqrt{L}[/latex]
Shallow water waves occur when the depth is less than 1/20 of the wavelength. In these cases, the wave is said to "touch bottom" because the depth is shallower than the wave base so the orbital motion is affected by the seafloor. Due to the shallow depth, the orbits are flattened, and eventually the water movement becomes horizontal rather than circular just above the bottom. The speed of shallow water waves depends only on the depth:
[latex]\text{speed (m/s)} = \sqrt{gd}[/latex]
where g is gravity and d is depth in meters. This can be simplified to:
[latex]\text{speed (m/s)} = 3.13\sqrt{d}[/latex]
Intermediate or transitional waves are found in depths between ½ and 1/20 of the wavelength. Their behavior is a bit more complex, as their speed is influenced by both wavelength and depth. The speed of an intermediate wave is calculated as:
which contains both depth and wavelength variables.
Waves generally begin as a disturbance of some kind, and the energy of that disturbance gets propagated in the form of waves. We are most familiar with the kind of waves that break on shore, or rock a boat at sea, but there are many other types of waves that are important to oceanography:
- Internal waves form at the boundaries of water masses of different densities (i.e. at a pycnocline), and propagate at depth. These generally move more slowly than surface waves, and can be much larger, with heights exceeding 100 m. However, the height of the deep wave would be unnoticeable at the surface.
- Tidal waves are due to the movement of the tides. What we think of as tides are basically enormously long waves with a wavelength that may span half the globe (see section 4.1). Tidal waves are not related to tsunamis, so don’t confuse the two.
- Tsunamis are large waves created as a result of earthquakes or other seismic disturbances. They are also called seismic sea waves (section 3.4).
- Splash waves are formed when something falls into the ocean and creates a splash. The giant wave in Lituya Bay that was described in the introduction to this chapter was a splash wave.
- Atmospheric waves form in the sky at the boundary between air masses of different densities. These often create ripple effects in the clouds (Figure 3.1.1).

There are several components to a basic wave (Figure 3.1.2):
- Still water level: where the water surface would be if there were no waves present and the sea was completely calm.
- Crest: the highest point of the wave.
- Trough: the lowest point of the wave.
- Wave height: the distance between the crest and the trough.
- Wavelength: the distance between two identical points on successive waves, for example crest to crest, or trough to trough.
- Wave steepness: the ratio of wave height to length (H/L). If this ratio exceeds 1/7 (i.e. height exceeds 1/7 of the wavelength) the wave gets too steep, and will break.

There are also a number of terms used to describe wave motion:
- Period: the time it takes for two successive crests to pass a given point.
- Frequency: the number of waves passing a point in a given amount of time, usually expressed as waves per second. This is the inverse of the period.
- Speed: how fast the wave travels, or the distance traveled per unit of time. This is also called celerity (c), where
c = wavelength x frequency
Therefore, the longer the wavelength, the faster the wave.
Although waves can travel over great distances, the water itself shows little horizontal movement; it is the energy of the wave that is being transmitted, not the water. Instead, the water particles move in circular orbits, with the size of the orbit equal to the wave height (Figure 3.1.3). This orbital motion occurs because water waves contain components of both longitudinal (side to side) and transverse (up and down) waves, leading to circular motion. As a wave passes, water moves forwards and up over the wave crests, then down and backwards into the troughs, so there is little horizontal movement. This is evident if you have ever watched an object such as a seabird floating at the surface. The bird bobs up and down as the wave pass underneath it; it does not get carried horizontally by a single wave crest.
Figure 3.1.3 Animation showing the orbital motion of particles in a surface wave (By Kraaiennest (Own work) [GFDL (http://www.gnu.org/copyleft/fdl.html) or CC BY-SA 4.0], via Wikimedia Commons).
The circular orbital motion declines with depth as the wave has less impact on deeper water and the diameter of the circles is reduced. Eventually at some depth there is no more circular movement and the water is unaffected by surface wave action. This depth is the wave base and is equivalent to half of the wavelength (Figure 3.1.4). Since most ocean waves have wavelengths of less than a few hundred meters, most of the deeper ocean is unaffected by surface waves, so even in the strongest storms marine life or submarines can avoid heavy waves by submerging below the wave base.
When the water below a wave is deeper than the wave base (deeper than half of the wavelength), those waves are called deep water waves. Most open ocean waves are deep water waves. Since the water is deeper than the wave base, deep water waves experience no interference from the bottom, so their speed only depends on the wavelength:
[latex]\text{speed (m/s)} = \sqrt{\frac{gL}{2\pi}}[/latex]
where g is gravity and L is wavelength in meters. Since g and π are constants, this can be simplified to:
[latex]\text{speed (m/s)} = 1.25\sqrt{L}[/latex]
Shallow water waves occur when the depth is less than 1/20 of the wavelength. In these cases, the wave is said to "touch bottom" because the depth is shallower than the wave base so the orbital motion is affected by the seafloor. Due to the shallow depth, the orbits are flattened, and eventually the water movement becomes horizontal rather than circular just above the bottom. The speed of shallow water waves depends only on the depth:
[latex]\text{speed (m/s)} = \sqrt{gd}[/latex]
where g is gravity and d is depth in meters. This can be simplified to:
[latex]\text{speed (m/s)} = 3.13\sqrt{d}[/latex]
Intermediate or transitional waves are found in depths between ½ and 1/20 of the wavelength. Their behavior is a bit more complex, as their speed is influenced by both wavelength and depth. The speed of an intermediate wave is calculated as:
which contains both depth and wavelength variables.
An earthquake is the shaking caused by the rupture (breaking) and subsequent displacement of rocks (one body of rock moving with respect to another) beneath Earth’s surface.
A body of rock that is under stress becomes deformed. When the rock can no longer withstand the deformation, it breaks and the two sides slide past each other. Because most rock is strong (unlike loose sand, for example), it can withstand a significant amount of deformation without breaking. But every rock has a deformation limit and will rupture (break) once that limit is reached. At that point, in the case of rocks within the crust, the rock breaks and there is displacement along the rupture surface. The magnitude of the earthquake depends on the extent of the area that breaks (the area of the rupture surface) and the average amount of displacement (sliding).
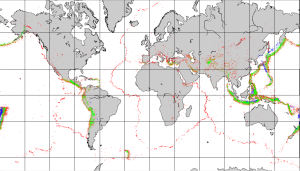
Most earthquakes take place near plate boundaries, but not necessarily right on a boundary, and not necessarily even on a pre-existing fault. The distribution of earthquakes across the globe is shown in Figure 2.8.1. It is relatively easy to see the relationships between earthquakes and the plate boundaries. Along divergent boundaries like the mid-Atlantic ridge and the East Pacific Rise, earthquakes are common, but restricted to a narrow zone close to the ridge, and consistently at less than 30 km depth. Shallow earthquakes are also common along transform faults, such as the San Andreas Fault. Along subduction zones earthquakes are very abundant, and they are increasingly deep on the landward side of the subduction zone.
Earthquakes are also relatively common at a few intraplate locations. Some are related to the buildup of stress due to continental rifting or the transfer of stress from other regions, and some are not well understood. Examples of intraplate earthquake regions include the Great Rift Valley area of Africa, the Tibet region of China, and the Lake Baikal area of Russia.
Earthquakes at Divergent and Transform Boundaries
Figure 2.8.2 provides a closer look at magnitude (M) 4 and larger earthquakes in an area of divergent boundaries in the mid-Atlantic region near the equator. Here, as we saw in section 3.5, the segments of the mid-Atlantic ridge are offset by some long transform faults. Most of the earthquakes are located along the transform faults, rather than along the spreading segments, although there are clusters of earthquakes at some of the ridge-transform boundaries. Some earthquakes do occur on spreading ridges, but they tend to be small and infrequent because of the relatively high rock temperatures in the areas where spreading is taking place. Earthquakes along divergent and transform boundaries tend to be shallow, as the crust is not very thick.

Earthquakes at Convergent Boundaries
The distribution and depths of earthquakes in the North Pacific are shown in Figure 2.8.3. In this region, the Pacific Plate is subducting beneath the North America Plate, creating the Aleutian Trench and the Aleutian Islands. Shallow earthquakes are common along the trench, but there is also significant earthquake activity extending down several hundred kilometers, as the subducting plate continues to interact at depth with the overriding plate. The earthquakes get deeper with distance from the trench; note in the left panel in Figure 2.8.3 that as you move along the transect from point a to point b, there is a trend of increasing earthquake depth. This reveals that it is the Pacific Plate that is moving northwards and being subducted.

The distribution of earthquakes in the area of the India-Eurasia plate boundary is shown in Figure 2.8.4. This is a continent-continent convergent boundary, and it is generally assumed that although the India Plate continues to move north toward the Asia Plate, there is no actual subduction taking place. There are transform faults on either side of the India Plate in this area.

The entire northern India and southern Asia region is very seismically active. Earthquakes are common in northern India, Nepal, Bhutan, Bangladesh and adjacent parts of China, and throughout Pakistan and Afghanistan. Many of the earthquakes are related to the transform faults on either side of the India Plate, and most of the others are related to the significant tectonic squeezing caused by the continued convergence of the India and Asia Plates. That squeezing has caused the Asia Plate to be thrust over top of the India Plate, building the Himalayas and the Tibet Plateau to enormous heights.
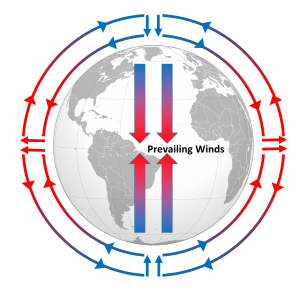
Differential heating of the Earth's surface results in equatorial regions receiving more heat than the poles (section 6.1). As air is warmed at the equator it becomes less dense and rises, while at the poles the cold air is denser and sinks. If the Earth was non-rotating, the warm air rising at the equator would reach the upper atmosphere and begin moving horizontally towards the poles. As the air reached the poles it would cool and sink, and would move over the surface of Earth back towards the equator. This would result in one large atmospheric convection cell in each hemisphere (Figure 6.2.1), with air rising at the equator and sinking at the poles, and the movement of air over the Earth's surface creating the winds. On this non-rotating Earth, the prevailing winds would thus blow from the poles towards the equator in both hemispheres (Figure 6.2.1).
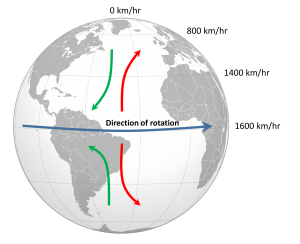
The non-rotating situation in Figure 6.2.1 is of course only hypothetical, and in reality the Earth's rotation makes this atmospheric circulation a bit more complex. The paths of the winds on a rotating Earth are deflected by the Coriolis Effect. The Coriolis Effect is a result of the fact that different latitudes on Earth rotate at different speeds. This is because every point on Earth must make a complete rotation in 24 hours, but some points must travel farther, and therefore faster, to complete the rotation in the same amount of time. In 24 hours a point on the equator must complete a rotation distance equal to the circumference of the Earth, which is about 40,000 km. A point right on the poles covers no distance in that time; it just turns in a circle. So the speed of rotation at the equator is about 1600 km/hr, while at the poles the speed is 0 km/hr. Latitudes in between rotate at intermediate speeds; approximately 1400 km/hr at 30o and 800 km/hr at 60o. As objects move over the surface of the Earth they encounter regions of varying speed, which causes their path to be deflected by the Coriolis Effect.
To explain the Coriolis Effect, imagine a cannon positioned at the equator and facing north. Even though the cannon appears stationary to someone on Earth, it is in fact moving east at about 1600 km/hr due to Earth's rotation. When the cannon fires the projectile travels north towards its target; but it also continues to move to the east at 1600 km/hr, the speed it had while it was still in the cannon. As the shell moves over higher latitudes, its momentum carries it eastward faster than the speed at which the ground beneath it is rotating. For example, by 30o latitude the shell is moving east at 1600 km/hr while the ground is moving east at only 1400 km/hr. Therefore, the shell gets "ahead" of its target, and will land to the east of its intended destination. From the point of view of the cannon, the path of the projectile appears to have been deflected to the right (red arrow, Figure 6.2.2). Similarly, a cannon located at 60o and facing the equator will be moving east at 800 km/hr. When its shell is fired towards the equator, the shell will be moving east at 800 km/hr, but as it approaches the equator it will be moving over land that is traveling east faster than the projectile. So the projectile gets "behind" its target, and will land to the west of its destination. But from the point of view of the cannon facing the equator, the path of the shell still appears to have been deflected to the right (green arrow, Figure 6.2.2). Therefore, in the Northern Hemisphere, the apparent Coriolis deflection will always be to the right.
In the Southern Hemisphere the situation is reversed (Figure 6.2.2). Objects moving towards the equator from the south pole are moving from low speed to high speed, so are left behind and their path is deflected to the left. Movement from the equator towards the south pole also leads to deflection to the left. In the Southern Hemisphere, the Coriolis deflection is always to the left from the point of origin.
The magnitude of the Coriolis deflection is related to the difference in rotation speed between the start and end points. Between the poles and 60o latitude, the difference in rotation speed is 800 km/hr. Between the equator and 30o latitude, the difference is only 200 km/hr (Figure 6.2.2). Therefore the strength of the Coriolis Effect is stronger near the poles, and weaker at the equator.
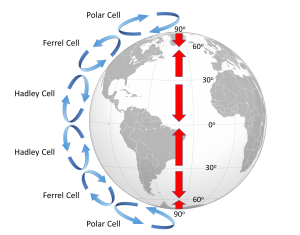
Because of the rotation of the Earth and the Coriolis Effect, rather than a single atmospheric convection cell in each hemisphere, there are three major cells per hemisphere. Warm air rising at the equator cools as it moves through the upper atmosphere, and it descends at around 30o latitude. The convection cells created by rising air at the equator and sinking air at 30o are referred to as Hadley Cells, of which there is one in each hemisphere. The cold air that descends at the poles moves over the Earth's surface towards the equator, and by about 60o latitude it begins to rise, creating a Polar Cell between 60o and 90o. Between 30o and 60o lie the Ferrel Cells, composed of sinking air at 30o and rising air at 60o (Figure 6.2.3). With three convection cells in each hemisphere that rotate in alternate directions, the surface winds no longer always blow from the poles towards the equator as in the non-rotating Earth in Figure 6.2.1. Instead, surface winds in both hemispheres blow towards the equator between 90o and 60o latitude, and between 0o and 30o latitude. Between 30o and 60o latitude, the surface winds blow towards the poles (Figure 6.2.3).
The surface winds created by the atmospheric convection cells are also influenced by the Coriolis Effect as they change latitudes. The Coriolis Effect deflects the path of the winds to the right in the Northern Hemisphere and to the left in the Southern Hemisphere. Adding this deflection leads to the pattern of prevailing winds illustrated in Figure 6.2.4. Between the equator and 30o latitude are the trade winds; the northeast trade winds in the Northern Hemisphere and the southeast trade winds in the Southern Hemisphere (note that winds are named based on the direction from which they originate, not where they are going). The westerlies are the dominant winds between 30o and 60o in both hemispheres, and the polar easterlies are found between 60o and the poles.
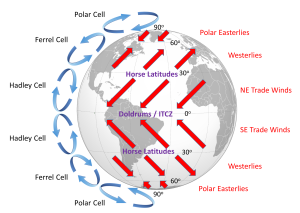
In between these wind bands lie regions of high and low pressure. High pressure zones occur where air is descending, while low pressure zones indicate rising air. Along the equator the rising air creates a low pressure region called the doldrums, or the Intertropical Convergence Zone (ITCZ)(convergence zone because this is where the trade winds converge). At 30o latitude there are high pressure zones of descending air known as the horse latitudes, or the subtropical highs. Finally, at 60o lies another low pressure region called the polar front. It should be noted that these high and low pressure zones are not fixed in place; their latitude fluctuates depending on the season, and these fluctuations have important implications for regional climates.
Doldrums? Horse latitudes? Trade winds?
These may seem like some odd names for these atmospheric phenomena, but many of them can be traced back to maritime traditions and lore.
The doldrums refer to regions of low pressure around the equator. In these areas, air is rising rather than moving horizontally, so these regions commonly encounter very light winds. The lack of wind could leave sailing ships becalmed for days or weeks at a time, which was not good for the morale of the ship's crew.
Like the doldrums the horse latitudes are also areas with light winds, this time due to descending air, which could leave ships becalmed. One explanation for the term "horse latitudes" is that when these ships became stranded they ran the risk of running out of food or water. To conserve these resources, sailors would throw their dead or dying horses overboard, hence the "horse latitudes." Another explanation is that many sailors received part of their pay before a voyage, and often spent it before departing. This meant that they would spend the first part of the voyage working without pay and in debt, a period called the "dead horse" time, which might last for a few months. When they started earning their pay once again, they had a "dead horse" ceremony and threw a pretend horse overboard. The timing of this ceremony often coincided with reaching the horse latitudes, leading to the association of the ceremony with the location. A third explanation is that a ship was referred to as "horsed" when winds were weak and the ship instead had to rely on ocean currents to move them. This could be a common occurrence in the high pressure zones around 30o latitude, so they were referred to as the horse latitudes.
The term trade winds may have originally derived from the terms for "track" or "path", but the term may have become more common during European exploration and commercialization of the New World. Mariners sailing from Europe to the New World could sail south until they reached the trade winds, which would then propel their ships across the Atlantic to the Caribbean. To return to Europe, ships could sail to the northeast until they entered the westerlies, which would then steer them back to Europe.

