By Paul Webb, used under a CC-BY 4.0 international license. Download this book for free at https://rwu.pressbooks.pub/webboceanography/front-matter/preface/
53 8.1 Primary Production
Primary production is the creation of new organic matter from inorganic substrates, and it is this organic matter that serves as the base of the food web for most marine consumers. Primary production generally refers to the process of photosynthesis, or the utilization of light energy to produce chemical fuels that is undertaken by plants and algae according to the reaction:
6CO2 + 6H2O → C6H12O6 + 6O2
Here, powered by light energy, carbon dioxide and water combine to produce glucose and oxygen. However, primary production is also carried out by bacteria in the absence of light through chemosynthesis. Instead of light providing the energy for the reaction, the energy comes from the oxidation of inorganic materials, such as hydrogen sulfide (see section 2.11 on hydrothermal vents). Here we will concentrate on photosynthesis because it plays a much larger role in total oceanic productivity than chemosynthesis.
The organisms responsible for oceanic primary production include a wide diversity of marine plants and algae. While many people may be more familiar with the larger seagrasses and macroalgae (seaweeds), by far the greatest amount of photosynthesis in the ocean comes from microscopic algae, the phytoplankton. The term “plankton” refers to organisms that drift with the currents, and the phytoplankton are the free-floating algae that undergo photosynthesis (contrast this with the zooplankton, who are the drifting animals). In section 8.2 we will take a closer look at the organisms responsible for oceanic primary production.
The total amount of organic material created by the producers is called the gross primary productivity, or total production. However, the primary producers consume a portion of this organic matter themselves through respiration, so the total amount that is left to support the consumers in the ocean is called net production (gross productivity – respiration). Gross production can be divided into two components, new production and regenerated production. New production is supported by nutrients brought in from outside of the local ecosystem through processes such as upwelling or ocean currents. Regenerated production results from the recycling of nutrients within an ecosystem.
Overall, marine productivity is similar to terrestrial production. Marine net production is about 35-50 billion metric tons per year, while terrestrial production reaches 50-70 billion tons per year. However, the biomass responsible for that production in the ocean is about 1-2 billion metric tons, compared to 600-1000 billion metric tons of biomass in terrestrial systems. So the oceans are producing almost as much organic material as terrestrial producers, but are doing it from only a fraction of the amount of producer biomass. One reason for this discrepancy is that the phytoplankton are constantly being consumed, while much of the terrestrial biomass is much longer-lived than the plankton.
By Paul Webb, used under a CC-BY 4.0 international license. Download this book for free at https://rwu.pressbooks.pub/webboceanography/front-matter/preface/
Estuaries are partially enclosed bodies of water where the salt water is diluted by fresh water input from land, creating brackish water with a salinity somewhere between fresh water and normal seawater. Estuaries include many bays, inlets, and sounds, and are often subject to large temperature and salinity variations due to their enclosed nature and smaller size compared to the open ocean.
Estuaries can be classified geologically into four basic categories based on their method of origin. In all cases they are a result of rising sea level over the last 18,000 years, beginning with the end of the last ice age; a period that has seen a rise of about 130 m. The rise in sea level has flooded coastal areas that were previously above water, and prevented the estuaries from being filled in by all of the sediments that have been emptied into them.
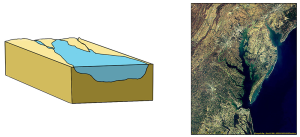
The first type is a coastal plain estuary, or drowned river valley. These estuaries are formed as sea level rises and floods an existing river valley, mixing salt and fresh water to create the brackish conditions where the river meets the sea. These types of estuaries are common along the east coast of the United States, including major bodies such as the Chesapeake Bay, Delaware Bay, and Narragansett Bay (Figure 4.6.1). Coastal plain estuaries are usually shallow, and since there is a lot of sediment input from the rivers, there are often a number of depositional features associated with them such as spits and barrier islands.
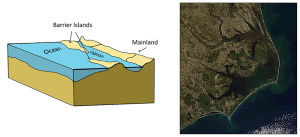
The presence of sand bars, spits, and barrier islands can lead to bar-built estuaries, where a barrier is created between the mainland and the ocean. The water that remains inside the sand bar is cut off from complete mixing with the ocean, and receives freshwater input from the mainland, creating estuarine conditions (Figure 4.6.2).
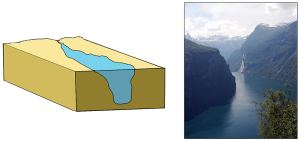
Fjords are estuaries formed in deep, U-shaped basins that were carved out by advancing glaciers. When the glaciers melted and retreated, sea level rose and filled these troughs, creating deep, steep-walled fjords (Figure 4.6.3). Fjords are common in Norway, Alaska, Canada, and New Zealand, where there are mountainous coastlines once covered by glaciers.
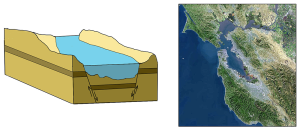
Tectonic estuaries are the result of tectonic movements, where faulting causes some sections of the crust to subside, and those lower elevation sections then get flooded with seawater. San Francisco Bay is an example of a tectonic estuary (Figure 4.6.4).
Estuaries are also classified based on their salinity and mixing patterns. The amount of mixing of fresh and salt water in an estuary depends on the rate at which fresh water enters the head of the estuary from river input, and the amount of seawater that enters the estuary mouth as a result of tidal movements. The input of fresh water is reflected in the flushing time of the estuary. This refers to the time it would take for the in-flowing fresh water to completely replace all the fresh water currently in the estuary. Seawater input is measured by the tidal volume, or tidal prism, which is the average volume of sea water entering and leaving the estuary during each tidal cycle. In other words, it is the volume difference between high and low tides. The interaction between the flushing time, tidal volume, and the shape of the estuary will determine the extent and type of water mixing within the estuary.
In a vertically mixed, or well-mixed estuary there is complete mixing of fresh and salt water from the surface to the bottom. In a particular location the salinity is constant at all depths, but across the estuary the salinity is lowest at the head where the fresh water enters, and is highest at the mouth, where the seawater comes in. This type of salinity profile usually occurs in shallower estuaries, where the shallow depths allow complete mixing from the surface to the bottom.
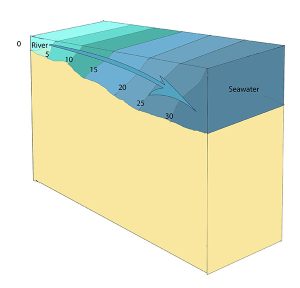
Slightly stratified or partially mixed estuaries have similar salinity profiles to vertically mixed estuaries, where salinity increases from the head to the mouth, but there is also a slight increase in salinity with depth at any point. This usually occurs in deeper estuaries than those that are well-mixed, where waves and currents mix the surface water, but the mixing may not extend all the way to the bottom.
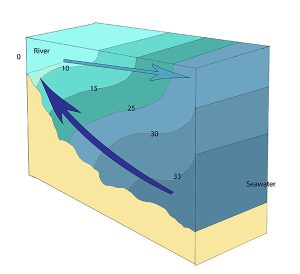
A salt wedge estuary occurs where the outflow of fresh water is strong enough to prevent the denser ocean water to enter through the surface, and where the estuary is deep enough that surface waves and turbulence have little mixing effect on the deeper water. Fresh water flows out along surface, salt water flows in at depth, creating a wedge shaped lens of seawater moving along the bottom. The surface water may remain mostly fresh throughout the estuary if there is no mixing, or it can become brackish depending on the level of mixing that occurs.

Highly stratified profiles are found in very deep estuaries, such as in fjords. Because of the depth, mixing of fresh and salt water only occurs near the surface, so in the upper layers salinity increases from the head to the mouth, but the deeper water is of standard ocean salinity.

Estuaries are very important commercially, as they are home to the majority of the world’s metropolitan areas, they serve as ports for industrial activity, and a large percentage of the world's population lives near estuaries. Estuaries are also very important biologically, especially in their role as the breeding grounds for many species of fish, birds, and invertebrates.
By Paul Webb, used under a CC-BY 4.0 international license. Download this book for free at https://rwu.pressbooks.pub/webboceanography/front-matter/preface/
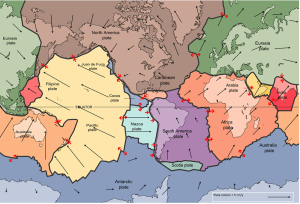
The idea of plate tectonics became widely accepted around 1965 as more and more geologists started thinking in these terms. By the end of 1967, Earth’s surface had been mapped into a series of plates (Figure 2.4.1). The major plates are Eurasia, Pacific, India, Australia, North America, South America, Africa, and Antarctic. There are also numerous small plates (e.g., Juan de Fuca, Nazca, Scotia, Philippine, Caribbean), and many very small plates or sub-plates. For example the Juan de Fuca Plate is actually three separate plates (Gorda, Juan de Fuca, and Explorer) that all move in the same general direction but at slightly different rates.
The fact that the plates include both crustal material and lithospheric mantle material makes it possible for a single plate to be made up of both oceanic and continental crust. For example, the North American Plate includes most of North America, plus half of the northern Atlantic Ocean. Similarly the South American Plate extends across the western part of the southern Atlantic Ocean, while the European and African plates each include part of the eastern Atlantic Ocean. The Pacific Plate is almost entirely oceanic, but it does include the part of California west of the San Andreas Fault.
Rates of motions of the major plates range from less than 1 cm/year to over 10 cm/year (for comparison, human fingernails grow at around 6 cm/year). The Pacific Plate is the fastest at over 10 cm/year in some areas, followed by the Australian and Nazca Plates. The North American Plate is one of the slowest, averaging around 1 cm/year in the south up to almost 4 cm/year in the north. Plates move as rigid bodies, so it may seem surprising that the North American Plate can be moving at different rates in different places. The explanation is that plates move in a rotational manner. The North American Plate, for example, rotates counter-clockwise; the Eurasian Plate rotates clockwise.
As originally described by Wegener in 1915, the present continents were once all part of the supercontinent Pangaea. More recent studies of continental match-ups and the magnetic ages of ocean-floor rocks have enabled us to reconstruct the history of the break-up of Pangaea.
Pangaea began to rift apart along a line between Africa and Asia and between North America and South America at around 200 Ma (Figure 2.4.2). During the same period, the Atlantic Ocean began to open up between northern Africa and North America, and India broke away from Antarctica. At this stage, Pangaea was divided into Laurasia (now Europe, Asia and North America) and Gondwanaland (the southern continents; South America, Africa, India, Australia, and Antarctica). Between 200 and 150 Ma, rifting started between South America and Africa and between North America and Europe, and India separated from Antarctica and moved north toward Asia. By 80 Ma, Africa had separated from South America, and most of Europe had separated from North America. By 50 Ma, Australia had separated from Antarctica, and shortly after that, India collided with Asia.
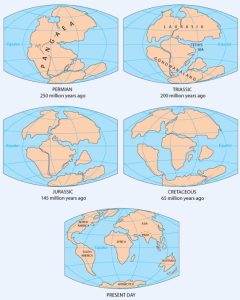
Over the next 50 million years, it is likely that there will be full development of the east African rift and creation of new ocean floor. Eventually Africa will split apart. There will also be continued northerly movement of Australia and Indonesia. The western part of California (including Los Angeles and part of San Francisco) will split away from the rest of North America, and eventually sail right by the west coast of Vancouver Island, en route to Alaska. Because the oceanic crust formed by spreading on the mid-Atlantic ridge is not currently being subducted (except in the Caribbean), the Atlantic Ocean is slowly getting bigger, and the Pacific Ocean is getting smaller. If this continues without changing for another couple hundred million years, we will be back to where we started, with one supercontinent.
Pangaea, which existed from about 350 to 200 Ma, was not the first supercontinent. In 1966, Tuzo Wilson proposed that there has been a continuous series of cycles of continental rifting and collision; that is, break-up of supercontinents, drifting, collision, and formation of other supercontinents. Pangaea was preceded by Pannotia (600 to 540 Ma), by Rodinia (1,100 to 750 Ma), and by other supercontinents before that.
With all of these plates constantly on the move, they inevitably end up interacting with each other at their plate boundaries. Plates can interact in three ways: they can move apart (divergent boundary), they can move towards each other (convergent boundary), or they can slide past each other (transform boundary). The following sections will examine each of these types of plate boundaries, and the geological features they create.
Additional links for more information:
- An interactive animation of plate motion over the past 550 million years: http://barabus.tru.ca/geol1031/plates.html
Our modern understanding of tide formation stems from Isaac Newton's Law of Universal Gravitation, which states that any two objects have a gravitational attraction to each other. The magnitude of the force is proportional to the masses of the objects, and inversely proportional to the square of the distance between the objects, according to the equation in Figure 3.5.1.
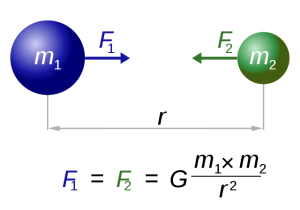
In the case of tides, there are a few other factors that modify this equation so that the distance (r) is cubed rather than squared, giving distance an even greater impact on tidal forces. But for our purposes, the important lesson is that the greater the masses of the objects, the greater the gravitational force, and the farther the objects are from each other, the weaker the force.
Such a gravitational force exists between the Earth and moon, attempting to pull them towards each other. Since the water covering Earth is fluid (unlike the solid land that is more resistant to tidal forces), this gravitational force pulls water towards the moon, creating a "bulge" of water on the side of the Earth facing the moon (Figure 3.5.2). This bulge always faces the moon, while the Earth rotates through it; the regions of Earth moving through the bulge experience a high tide, while those parts of the Earth away from the bulge experience a low tide.
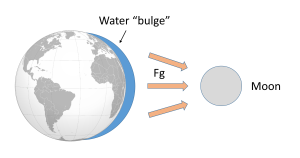
If the tides were this simple, everywhere on Earth would see one high tide per day, as there would only be a bulge of water on the side closest to the moon. However, if you have ever looked at tide charts, or lived near the ocean, you probably know that in most places there are two high tides and two low tides per day. Where is this second high tide "bulge" coming from?
The gravitational force between the Earth and moon might be expected to draw the two objects closer together, however, this is not happening. This is because the inward gravitational force is opposed by outward forces that keep the Earth and moon apart. The outward force is an intertial force created by the rotation of the Earth and moon. Contrary to popular belief, the moon is not simply rotating around the Earth; in fact, the Earth and moon are both rotating around each other. Imagine the Earth and moon as equal-sized objects revolving around a point at their center of mass. If both objects had the same mass, the center of rotation would be a point equidistant between the two objects. But since the mass of the Earth is 82 times greater than the mass of the moon, the center of revolution must be closer to the Earth. As an analogy, think about two people on a see-saw. If the people are of roughly equal size, they can sit on either end of the see-saw at it will rotate around a point at equal distance between them. But if the two people have very different masses, such as a large adult and a small child, the larger person must move closer to the pivot point for the see-saw to rotate effectively. In the same way, the center of rotation between the Earth and the moon (the barycenter) must be located closer to the Earth. In fact, the center of rotation lies within the Earth, about 1600 km below the surface. As the Earth and moon rotate around the barycenter, the moon travels much farther than the Earth, giving the impression that the moon is rotating around Earth (Figure 3.5.3).

The rotation of the Earth-moon system creates an outward inertial force, which balances the gravitational force to keep the two bodies in their orbits. The inertial force has the same magnitude everywhere on Earth, and is always directed away from the moon. Gravitational force, on the other hand, is always directed towards the moon, and is stronger on the side of the Earth closest to the moon. Figure 3.5.4 describes how these forces combine to create the tidal forces. At point O in the center of the Earth, the gravitational force (Fg) and the inertial force (Fr) are equal, and cancel each other out. On the side of Earth closest to the moon, the inward gravitational force (Fg) is greater than the outward inertial force (Fr); the net resulting force (A) is directed towards the moon, and creates a bulge of water on the side facing the moon. On the side of Earth opposite the moon, the outward inertial force is greater than the inward gravitational force; the net resulting force (C) is directed away from the moon, creating a water bulge directed away from the moon.
Now, as the Earth rotates through a 24 hour day, each region passes through two bulges, and experiences two high tides and two low tides per day. This represents Newton's Equilibrium Theory of Tides, where there are two high tides and two low tides per day, of similar heights, each six hours apart. But as with everything else in oceanography, reality is much more complex than this idealized situation.

Some of the additional complexity is because in addition to the moon, the sun also exerts tide-affecting forces on Earth. The solar gravitational and inertial forces arise for the same reasons described above for the moon, but the magnitudes of the forces are different. The sun is 27 million times more massive than the moon, but it is 387 times farther away from the Earth. Despite its larger mass, because the sun is so much farther away than the moon, the sun's gravitational forces are only about half as strong as the moon's (remember that distance is cubed in the gravity equation). The sun thus creates its own, smaller water bulges, independent of the moon's, that contribute to the creation of tides.
When the sun, Earth and moon are aligned, as occurs during new and full moons, the solar and lunar bulges are also aligned, and add to each other (constructive interference; see section 4.2) creating an especially high tidal range; high high tides and low low tides (Figure 3.5.5). This period of maximum tidal range is called a spring tide, and they occur every two weeks.

When the sun, Earth and moon are at 90o to each other, the solar and lunar bulges are out of phase, and cancel each other out (destructive interference). Now the tidal range is small, with low high tides and high low tides (Figure 3.5.6). These are neap tides, and occur every two weeks, when the moon is in its 1/4 and 3/4 phases (Figure 3.5.7).


By Paul Webb, used under a CC-BY 4.0 international license. Download this book for free at https://rwu.pressbooks.pub/webboceanography/front-matter/preface/
Estuaries are partially enclosed bodies of water where the salt water is diluted by fresh water input from land, creating brackish water with a salinity somewhere between fresh water and normal seawater. Estuaries include many bays, inlets, and sounds, and are often subject to large temperature and salinity variations due to their enclosed nature and smaller size compared to the open ocean.
Estuaries can be classified geologically into four basic categories based on their method of origin. In all cases they are a result of rising sea level over the last 18,000 years, beginning with the end of the last ice age; a period that has seen a rise of about 130 m. The rise in sea level has flooded coastal areas that were previously above water, and prevented the estuaries from being filled in by all of the sediments that have been emptied into them.
The first type is a coastal plain estuary, or drowned river valley. These estuaries are formed as sea level rises and floods an existing river valley, mixing salt and fresh water to create the brackish conditions where the river meets the sea. These types of estuaries are common along the east coast of the United States, including major bodies such as the Chesapeake Bay, Delaware Bay, and Narragansett Bay (Figure 4.6.1). Coastal plain estuaries are usually shallow, and since there is a lot of sediment input from the rivers, there are often a number of depositional features associated with them such as spits and barrier islands.

The presence of sand bars, spits, and barrier islands can lead to bar-built estuaries, where a barrier is created between the mainland and the ocean. The water that remains inside the sand bar is cut off from complete mixing with the ocean, and receives freshwater input from the mainland, creating estuarine conditions (Figure 4.6.2).

Fjords are estuaries formed in deep, U-shaped basins that were carved out by advancing glaciers. When the glaciers melted and retreated, sea level rose and filled these troughs, creating deep, steep-walled fjords (Figure 4.6.3). Fjords are common in Norway, Alaska, Canada, and New Zealand, where there are mountainous coastlines once covered by glaciers.

Tectonic estuaries are the result of tectonic movements, where faulting causes some sections of the crust to subside, and those lower elevation sections then get flooded with seawater. San Francisco Bay is an example of a tectonic estuary (Figure 4.6.4).

Estuaries are also classified based on their salinity and mixing patterns. The amount of mixing of fresh and salt water in an estuary depends on the rate at which fresh water enters the head of the estuary from river input, and the amount of seawater that enters the estuary mouth as a result of tidal movements. The input of fresh water is reflected in the flushing time of the estuary. This refers to the time it would take for the in-flowing fresh water to completely replace all the fresh water currently in the estuary. Seawater input is measured by the tidal volume, or tidal prism, which is the average volume of sea water entering and leaving the estuary during each tidal cycle. In other words, it is the volume difference between high and low tides. The interaction between the flushing time, tidal volume, and the shape of the estuary will determine the extent and type of water mixing within the estuary.
In a vertically mixed, or well-mixed estuary there is complete mixing of fresh and salt water from the surface to the bottom. In a particular location the salinity is constant at all depths, but across the estuary the salinity is lowest at the head where the fresh water enters, and is highest at the mouth, where the seawater comes in. This type of salinity profile usually occurs in shallower estuaries, where the shallow depths allow complete mixing from the surface to the bottom.

Slightly stratified or partially mixed estuaries have similar salinity profiles to vertically mixed estuaries, where salinity increases from the head to the mouth, but there is also a slight increase in salinity with depth at any point. This usually occurs in deeper estuaries than those that are well-mixed, where waves and currents mix the surface water, but the mixing may not extend all the way to the bottom.

A salt wedge estuary occurs where the outflow of fresh water is strong enough to prevent the denser ocean water to enter through the surface, and where the estuary is deep enough that surface waves and turbulence have little mixing effect on the deeper water. Fresh water flows out along surface, salt water flows in at depth, creating a wedge shaped lens of seawater moving along the bottom. The surface water may remain mostly fresh throughout the estuary if there is no mixing, or it can become brackish depending on the level of mixing that occurs.
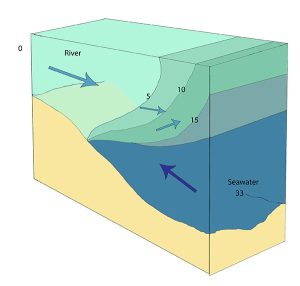
Highly stratified profiles are found in very deep estuaries, such as in fjords. Because of the depth, mixing of fresh and salt water only occurs near the surface, so in the upper layers salinity increases from the head to the mouth, but the deeper water is of standard ocean salinity.

Estuaries are very important commercially, as they are home to the majority of the world’s metropolitan areas, they serve as ports for industrial activity, and a large percentage of the world's population lives near estuaries. Estuaries are also very important biologically, especially in their role as the breeding grounds for many species of fish, birds, and invertebrates.
By Paul Webb, used under a CC-BY 4.0 international license. Download this book for free at https://rwu.pressbooks.pub/webboceanography/front-matter/preface/
Sea level change has been a feature on Earth for billions of years, and it has important implications for coastal processes, estuaries, and both erosional and depositional features. There are two main mechanisms of sea level change, eustatic and isostatic, as described below.
Eustatic sea level changes are global sea level changes related to changes in the volume of water in the ocean. These can be due to changes in the volume of glacial ice on land, thermal expansion of the water, or to changes in the shape of the seafloor caused by plate tectonic processes. For example, seafloor spreading widens an ocean basin, thus changing its volume and affecting sea level.
Over the past 20,000 years, there has been approximately 125 m of eustatic sea level rise due to glacial melting. Most of that took place between 15,000 and 7,500 years ago during the major melting phase of the North American and Eurasian Ice Sheets (Figure 4.7.1). At around 7,500 years ago, the rate of glacial melting and sea level rise decreased dramatically, and since that time, the average rate has been in the order of 0.7 mm/year.
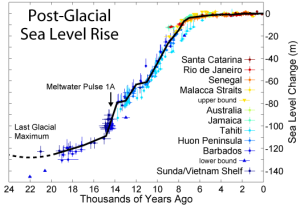
Anthropogenic climate change led to accelerating sea level rise starting around 1870. Since that time, the average rate has been 1.1 mm/year, but it has been gradually increasing. Since 1992, the average rate has been 3.2 mm/year (Figure 4.7.2). Much of this is due to increased glacial melting as the global climate gets warmer, but a large part is due to thermal expansion of the water. As water warms, the molecules gain more kinetic energy and move faster and farther apart; the result is that the same amount of water now takes up more space. So even without the input of new water from melting ice, warming ocean temperatures will cause sea level to rise.

Isostatic sea level changes are local changes caused by subsidence or uplift of the crust related either to changes in the amount of ice on the land, or to growth or erosion of mountains. Almost all of Canada and parts of the northern United States were covered in thick ice sheets at the peak of the last glaciation. Following the melting of this ice, there has been an isostatic rebound of continental crust in many areas. This ranges from several hundred meters of rebound in the central part of the Laurentide Ice Sheet (around Hudson Bay) to 100 m to 200 m in places such as Vancouver Island and the mainland coast of British Columbia. In other words, although global sea level was about 130 m lower during the last glaciation, the glaciated regions were depressed at least that much in most places, and more than that in places where the ice was thickest. Tectonic processes, such as the uplift of crust, can also cause localized changes in sea level.
By Paul Webb, used under a CC-BY 4.0 international license. Download this book for free at https://rwu.pressbooks.pub/webboceanography/front-matter/preface/
Modified from "Physical Geology" by Steven Earle used under a CC-BY 4.0 international license. Download this book for free at http://open.bccampus.ca
Some coastal areas are dominated by erosion, an example being the Pacific coast of North America, while others are dominated by deposition, examples being the Atlantic and Caribbean coasts of the United States. But on almost all coasts, both deposition and erosion are happening to varying degrees most of the time, although in different places. On deposition-dominant coasts, the coastal sediments are still being eroded from some areas and deposited in others.
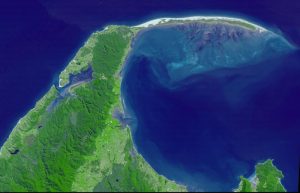
On coasts that are dominated by depositional processes, most of the sediment being deposited typically comes from large rivers. Much of the sediment is immediately deposited at the mouth of the river, creating large fan-shaped deltas. An obvious example is where the Mississippi River flows into the Gulf of Mexico at New Orleans; another is the Yellow (Huang He) River in China (Figure 4.4.1).

Figure 4.4.1 The Yellow River delta in China, created by one of the most sediment-laden rivers on Earth (NASA [Public domain], via Wikimedia Commons).

Tombolos are common where islands are abundant, and they typically form where there is a wave shadow behind a nearshore island (Figure 4.4.4). This becomes an area with reduced energy, and so the longshore current slows and sediments accumulate. Eventually enough sediments accumulate to connect the island to the mainland with a tombolo (Figure 4.4.5).


In areas where coastal sediments are abundant and coastal relief is low (because there has been little or no recent coastal uplift), it is common for barrier islands to form (Figure 4.4.6). Barrier islands are elongated islands composed of sand that form offshore from the mainland, potentially reaching several kilometers wide and hundreds of kilometers long. They are common along the U.S. Gulf Coast from Texas to Florida, and along the U.S. Atlantic Coast from Florida to Massachusetts. The islands often form as the result of sediment moving offshore through river discharge, while wave action works to push the sediment back towards the shore. The resulting sediment buildup is then stretched into long barrier islands by longshore transport.

Mature barrier islands contain a number of ecological zones. Beginning on the ocean side of the island there is a beach, consisting of the zones we discussed in section 4.1. Behind the beach lie dunes that are built up by sand transported by wind. The ocean side of the dunes are home to grasses and other plants which help stabilize the sand from erosion, and also help slow down the wind to allow sand to settle and accumulate. Beyond the dunes lies a more heavily vegetated barrier flat, covered by larger shrubs and trees that are tolerant to the high winds and salty conditions. As the land slopes down on the side of the island facing the mainland, the low-lying areas transition into a salt marsh or mud flat habitat, which is protected from wave action, but is influenced by tidal changes. The mud flats are colonized by grasses, which slow down the movement of water and lead to increased sediment deposition, building up the land in the marsh. Different species of grasses eventually dominate the different elevations of the salt marsh, depending on their tolerance for submersion in seawater. These salt marshes are very important habitats for many invertebrates, birds, and juvenile fish. Between the island and the mainland lies a lagoon, which usually contains brackish water from the mixing of fresh water runoff from the land and the seawater within a somewhat enclosed space. Barrier islands, although attractive locations for beach houses, are not permanent structures, and people should be wary of building on them. Over time, the erosion on the seaward side of the island, and the expansion of the marsh on the landward side, causes the island to slowly move towards the mainland, eventually closing off the lagoon. Maintaining dune grasses is one way to slow this movement, and as we will see in the next section, people have developed a number of other strategies to try to curtail the natural erosion of beaches.
By Paul Webb, used under a CC-BY 4.0 international license. Download this book for free at https://rwu.pressbooks.pub/webboceanography/front-matter/preface/
Modified from "Physical Geology" by Steven Earle used under a CC-BY 4.0 international license. Download this book for free at http://open.bccampus.ca
So how did the oceans form in the first place? The early Earth was formed through the accretion of various materials, and that a period of melting and intense volcanic activity followed. The materials that accreted on the early Earth contained the components that would eventually become our oceans and atmosphere. There are a few hypotheses concerning the origin of the oceans. One suggests that under the high pressures found in the Earth's interior, gases remain dissolved in magma. As these magmas rise to the surface through volcanic activity, the pressure is reduced and the gases are released through a process called outgassing. Volcanic activity releases many different gases, including water vapor, carbon dioxide (CO2), sulfur dioxide (SO2), carbon monoxide (CO), hydrogen sulfide (H2S), hydrogen gas, nitrogen, and methane (CH4). Lighter gases such as hydrogen and helium dissipated into space, but the heavier gases remained and formed Earth's early atmosphere, and potentially surface water. Another idea is that during this early bombardment, water was brought to Earth through comets, which are mostly dust and ice, and/or meteorites that may have contained traces of water that could have accumulated on the Earth's surface. These hypotheses are not mutually exclusive, and it's possible that all of them contributed to the formation of the oceans.
The rise of atmospheric oxygen
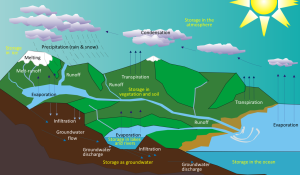
As the early Earth cooled, the water vapor in the atmosphere condensed and fell as rain. By about 4 billion years ago, the first permanent accumulations of water were present on Earth, forming the oceans and other bodies of water. Water moves between these different reservoirs through the hydrological cycle. Water is evaporated from the oceans, lakes, streams, the surface of the land, and plants (transpiration) by solar energy (Figure 5.2.1). It is moved through the atmosphere by winds and condenses to form clouds of water droplets or ice crystals. It comes back down as rain or snow and then flows through streams and rivers, into lakes, and eventually back to the oceans. Water on the surface and in streams and lakes infiltrates the ground to become groundwater. Groundwater slowly moves through the rock and surface materials; some returns to other streams and lakes, and some goes directly back to the oceans.
Water is stored in various reservoirs as it moves through this cycle. The largest, by far, is the oceans, accounting for 97% of the volume (Figure 5.2.2). Of course, that water is salty. The remaining 3% is fresh water. Two-thirds of our fresh water is stored in ice and one-third is stored as groundwater. The remaining fresh water — about 0.03% of the total — is stored in lakes, streams, vegetation, and the atmosphere.
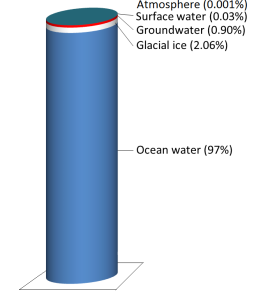
To put that in perspective, let’s think about putting all of Earth’s water into a 1 L jug. We start by almost filling the jug with 970 ml of water and 34 g of salt. Then we add one regular-sized (~20 mL) ice cube (representing glacial ice) and two teaspoons (~10 mL) of groundwater. All of the water that we see around us in lakes and streams and up in the sky can be represented by adding three more drops from an eyedropper.
Although the proportion of Earth’s water that is in the atmosphere is tiny, the actual volume is huge. At any given time, there is the equivalent of approximately 13,000 km3 of water in the air in the form of water vapor and water droplets in clouds. Water is evaporated from the oceans, vegetation, and lakes at a rate of 1,580 km3 per day, and just about exactly the same volume falls as rain and snow every day, over both the oceans and land. The precipitation that falls on land goes back to the ocean in the form of stream flow (117 km3/day) and groundwater flow (6 km3/day).
How did the oceans get salty?
Outgassing was responsible for ocean formation, but how did the ocean water get salty? Most of the salts and dissolved elements in the ocean were probably outgassed along with the water vapor, so the ocean has probably always been about as salty as it is now. But we know that rainfall and other processes weather rocks on the Earth's surface, and runoff carries dissolved substances into the ocean, contributing to its salinity. Yet despite this constant input, the ocean’s salt composition remains essentially the same. Therefore, the rate of input of new material must be balanced by the rate of removal; in other words, the oceans are in a steady state in regards to salinity.
There are multiple pathways through which dissolved ions enter the ocean; runoff from streams and rivers, volcanic activity, hydrothermal vents (see section 2.11), dissolution or decay of substances in the ocean, and groundwater input. Ions are removed from seawater as they are incorporated by living organisms (for example in shell production) or sediments, sea spray, percolation of water into the crust, or when sea water gets isolated from the ocean and evaporates.
The relationship between the input and removal of an ion can be examined through the concept of residence time, which is the average length of time a single atom of an element remains in the ocean before being removed. Residence time is calculated as:
[latex]\text { Residence time} =\frac{\text{amount of the substance in the ocean}}{\text {the rate at which the substance is added or removed}}[/latex]
There is great variation in residence times for different substances (Table 5.2.1). Generally speaking, substances that are readily used in biological processes have short residence times, as they are used up as they become available. Substances with longer residence times are less reactive, and may be a part of long-scale geological cycles.
Table 5.2.1 Residence times for some constituents of sea water
| Constituent | Residence time (years) |
|---|---|
| Chloride (Cl-) | 100,000,000 |
| Sodium (Na+) | 68,000,000 |
| Calcium (Ca2+) | 1,000,000 |
| Water | 4100 |
| Iron (Fe) | 200 |
So what about lakes? They are subjected to runoff and river input, so why aren't they salty like the oceans? One reason is that compared to the oceans, lakes and ponds are relatively temporary phenomena, so they do not last long enough to accumulate the same levels of ions as the oceans. Furthermore, lakes often have rivers flowing both into and out of them, so many ions are removed through the outflow, eventually finding their way to the oceans. The oceans only receive river input; there are no rivers flowing out of the ocean to remove these materials, so they are found in greater abundance in sea water. It should be noted that there are some lakes that contain water whose salt content may rival or exceed that of the ocean; these lakes usually lack river outflow. The Great Salt Lake in the western United States is an example.
By Paul Webb, used under a CC-BY 4.0 international license. Download this book for free at https://rwu.pressbooks.pub/webboceanography/front-matter/preface/
Modified from "Physical Geology" by Steven Earle used under a CC-BY 4.0 international license. Download this book for free at http://open.bccampus.ca

