48 7.3 The Ekman Spiral and Geostrophic Flow
Ekman spiral
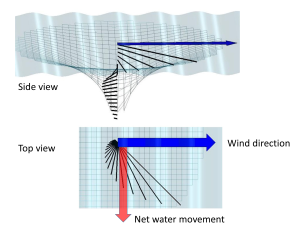
Winds blowing over the ocean are ultimately what create the surface currents. However, not all of the water moved by the surface currents is transported in the same direction. The Coriolis Effect causes the surface water to move in a direction about 45 degrees offset from the wind direction, with the deflection to the right of the wind in the Northern Hemisphere and to the left in the Southern Hemisphere. The frictional movement of the topmost layer of water sets in motion the layer directly underneath it, which then sets in motion the next layer under that, and so on as the water gets deeper. Some energy is lost in each transition, so each successive layer of water will not move as far as the layer above it; in other words, there is decreasing energy with increasing depth. But at the same time, the Coriolis Effect deflects each layer relative to the layer above it (again, to the right in the Northern Hemisphere and to the left in the Southern Hemisphere). The movement of the successive layers therefore creates a spiraling pattern of water motion called the Ekman spiral, which usually penetrates to about 100 m deep before the motion ceases. If the magnitudes and directions of the movements of each layer are added together, the result is that the net movement of the upper 100 m of the water column is 90o relative to the original wind direction (90o to the right of the wind in the Northern Hemisphere, and 90o to the left in the Southern Hemisphere). This net water movement is called Ekman transport (Figure 7.3.1).
Geostrophic flow
Gyre rotation is dependent on the wind and the Coriolis Effect impacting the surface currents (see section 7.1). But the rotation is also affected by movement below the surface due to Ekman transport. In the Northern Hemisphere, as the gyre rotates clockwise the net movement of the Ekman transport is 90o to the right of the wind; in other words, towards the center of the gyre. The Ekman transport piles up water in the center of the gyre, making the water level higher in the gyre center than on the edges of the gyres. This pile of water then has a tendency to flow back “downhill” due to gravity. As the water flows “downhill” away from the gyre center, it is deflected to the right by the Coriolis force. This results in a clockwise current around the central “hill” called geostrophic flow, which moves in the same direction as the rotating gyre. Water is thus pushed into the “hill” by Ekman transport, and away from the “hill” by gravity, with both flows modified by the Coriolis Effect to create the rotation. As with the gyres, geostrophic flow is clockwise in the Northern Hemisphere, and counterclockwise in the Southern Hemisphere.
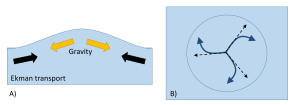
Most major surface currents are a combination of wind-driven and geostrophic currents. Since winds can be variable, geostrophic flow ensure that the gyre currents keep moving at a fairly constant rate even when the wind dies down. The larger the area, and the higher the slope, the longer the geostrophic flow will continue to move and power the gyre after the wind subsides.
Convergent boundaries, where two plates are moving toward each other, are of three types, depending on the type of crust present on either side of the boundary — oceanic or continental. The types are ocean-ocean, ocean-continent, and continent-continent.
At an ocean-ocean convergent boundary, one of the plates (oceanic crust and lithospheric mantle) is pushed, or subducted, under the other (Figure 2.6.1). Often it is the older and colder plate that is denser and subducts beneath the younger and warmer plate. There is commonly an ocean trench along the boundary as the crust bends downwards. The subducted lithosphere descends into the hot mantle at a relatively shallow angle close to the subduction zone, but at steeper angles farther down (up to about 45°). The significant volume of water within the subducting material is released as the subducting crust is heated. It mixes with the overlying mantle, and the addition of water to the hot mantle lowers the crust’s melting point and leads to the formation of magma (flux melting). The magma, which is lighter than the surrounding mantle material, rises through the mantle and the overlying oceanic crust to the ocean floor where it creates a chain of volcanic islands known as an island arc. A mature island arc develops into a chain of relatively large islands (such as Japan or Indonesia) as more and more volcanic material is extruded and sedimentary rocks accumulate around the islands. Earthquakes occur relatively deep below the seafloor, where the subducting crust moves against the overriding crust.
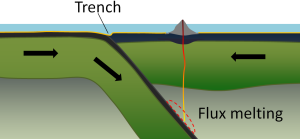
Examples of ocean-ocean convergent zones are subduction of the Pacific Plate south of Alaska (creating the Aleutian Islands) and under the Philippine Plate, where it creates the Marianas Trench, the deepest part of the ocean.
At an ocean-continent convergent boundary, the denser oceanic plate is pushed under the less dense continental plate in the same manner as at an ocean-ocean boundary. Sediment that has accumulated on the seafloor is thrust up into an accretionary wedge, and compression leads to thrusting within the continental plate (Figure 2.6.2). The magma produced adjacent to the subduction zone rises to the base of the continental crust and leads to partial melting of the crustal rock. The resulting magma ascends through the crust, producing a mountain chain with many volcanoes. As with an ocean-ocean boundary, the subducting crust can produce a deep trench running parallel to the coastline.
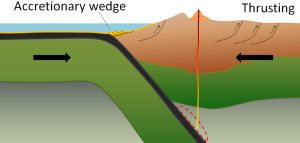
Examples of ocean-continent convergent boundaries are subduction of the Nazca Plate under South America (which has created the Andes Mountains and the Peru Trench) and subduction of the Juan de Fuca Plate under North America (creating the Cascade Range).
A continent-continent collision occurs when a continent or large island that has been moved along with subducting oceanic crust collides with another continent (Figure 2.6.3). The colliding continental material will not be subducted because it is too light (i.e., because it is composed largely of light continental rocks), but the root of the oceanic plate will eventually break off and sink into the mantle. There is tremendous deformation of the pre-existing continental rocks, forcing the material upwards and creating mountains.

Examples of continent-continent convergent boundaries are the collision of the India Plate with the Eurasian Plate, creating the Himalaya Mountains, and the collision of the African Plate with the Eurasian Plate, creating the series of ranges extending from the Alps in Europe to the Zagros Mountains in Iran.
Learning Objectives
After reading this chapter you should be able to:
- identify the parts of a basic wave
- define the terminology used to describe the motion of a wave (i.e. period, frequency, speed etc.)
- explain the circular motion of water particles involved in wave motion
- explain the difference between deep water waves and shallow water waves
- identify the factors that influence wave speed in deep and shallow waves
- identify the factors that determine the energy of wind-generated waves
- define the concept of restoring force
- define significant wave height
- explain the creation of ocean swell
- define the concepts of destructive, constructive and mixed interference
- explain why waves break as they approach shore
- explain the differences in the different types of breakers, and how the bottom topography impacts breaker type
- explain why waves approach parallel to shore, and why waves are larger off of points and smaller in bays
- explain how tsunamis are formed, and how they behave in the ocean
- explain Newton's Law of Universal Gravitation and how it applies to tides
- explain why most places on Earth experience two tides per day, not just the one predicted from gravitational attraction between the Earth and moon
- explain how the Earth, sun and moon interact to create spring and neap tides
- explain why the sun has a smaller effect on tides than the moon
- explain why tides do not occur at the same time every day
- explain the concept of amphidromic circulation
- identify diurnal, semi-diurnal, and mixed tides
- identify the phases of a tidal current
- define a tidal bore
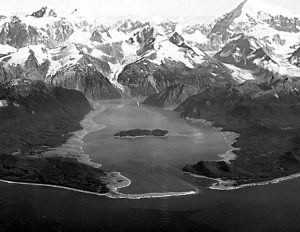
Waves come in many shapes and sizes; a 100 foot wave might be a surfer's dream, but a ship captain's nightmare. What was the largest wave ever recorded? 50 feet? 100 feet? Not even close. That record belongs to a wave created in Lituya Bay, Alaska, on July 9, 1958 (Figure 3.1). On that day, a magnitude 7.8 earthquake caused a massive rockslide that slid down a mountainside and into the headwaters of the bay. The rockslide created a splash wave that was high enough to flatten vegetation up to 1722 ft (525 m) above sea level! The wave then moved through the narrow bay towards the sea, destroying a number of fishing boats along the way. Miraculously, a father and son on one fishing boat were carried above the trees by the wave, and survived to tell the story. This is by far the largest wave, a megatsunami, ever reliably recorded. The waves we will discuss in this chapter may not be quite that dramatic, but it is still important to know how they form, how they are propagated, and what happens to them as they interact with the shore.
After discussing various types of waves at sea and along the shore, we will discuss tides. However, at least in terms of wavelength, the largest waves in the ocean are the tides, where one wavelength stretches halfway around the Earth. The crests of these long waves represent the high tides, while the troughs create low tides.
You probably learned when you were younger that the basic cause of the tides is the gravitational attraction between the Earth and moon. This is a very old idea, as the Greek scientist Pytheas first made the connection between the tides and the moon back in 330 B.C.E. Isaac Newton's gravitational work the 1600s led to our modern understanding of tidal cycles, however, we now know that the tides involve a lot more than just the Earth and the moon. There are many variables that influence the tides, yet despite this complexity, we are able to create accurate tide charts predicting the heights and timing of tides months or even years in advance.
Modified from Paul Webb, used under a CC-BY 4.0 international license. Download this book for free at https://rwu.pressbooks.pub/webboceanography/front-matter/preface/
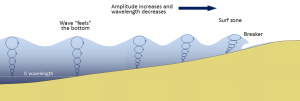
Most of the waves discussed in the previous section referred to deep water waves in the open ocean. But what happens when these waves move towards shore and encounter shallow water? Remember that in deep water, a wave’s speed depends on its wavelength, but in shallow water wave speed depends on the depth (section 3.1). When waves approach the shore they will "touch bottom" at a depth equal to half of their wavelength; in other words, when the water depth equals the depth of the wave base (Figure 3.3.1). At this point their behavior will begin to be influenced by the bottom.
When the wave touches the bottom, friction causes the wave to slow down. As one wave slows down, the one behind it catches up to it, thus decreasing the wavelength. However, the wave still contains the same amount of energy, so while the wavelength decreases, the wave height increases. Eventually the wave height exceeds 1/7 of the wavelength, and the wave becomes unstable and forms a breaker. Often breakers will start to curl forwards as they break. This is because the bottom of the wave begins to slow down before the top of the wave, as it is the first part to encounter the seafloor. So the crest of the wave gets “ahead” of the rest of the wave, but has no water underneath it to support it (Figure 3.3.1).
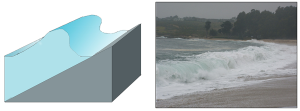
There are three main types of breakers: spilling, plunging, and surging. These are related to the steepness of the bottom, and how quickly the wave will slow down and its energy will get dissipated.
- Spilling breakers form on gently sloping or flatter beaches, where the energy of the wave is dissipated gradually. The wave slowly increases in height, then slowly collapses on itself (Figure 3.3.2). For surfers, these waves provide a longer ride, but they are less exciting.

- Plunging breakers form on more steeply-sloped shores, where there is a sudden slowing of the wave and the wave gets higher very quickly. The crest outruns the rest of the wave, curls forwards and breaks with a sudden loss of energy (Figure 3.3.3). These are the “pipeline” waves that surfers seek out.
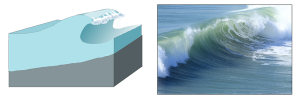
- Surging breakers form on the steepest shorelines. The wave energy is compressed very suddenly right at the shoreline, and the wave breaks right onto the beach (Figure 3.3.4). These waves give too short (and potentially painful) a ride for surfers to enjoy.
Wave Refraction
Swell can be generated anywhere in the ocean and therefore can arrive at a beach from almost any direction. But if you have ever stood at the shore you have probably noticed that the waves usually approach the shore somewhat parallel to the coast. This is due to wave refraction. If a wave front approaches shore at an angle, the end of the wave front closest to shore will touch bottom before the rest of the wave. This will cause that shallower part of the wave to slow down first, while the rest of the wave that is still in deeper water will continue on at its regular speed. As more and more of the wave front encounters shallower water and slows down, the wave font refracts and the waves tend to align themselves nearly parallel to the shoreline (they are refracted towards the region of slower speed). As we will see in section 5.2, the fact that the waves do not arrive perfectly parallel to the beach causes longshore currents and longshore transport that run parallel to the shore.
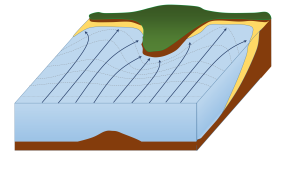
Refraction can also explain why waves tend to be larger off of points and headlands, and smaller in bays. A wave front approaching shore will touch the bottom off of the point before it touches bottom in a bay. Once again, the shallower part of the wave front will slow down, and cause the rest of the wave front to refract towards the slower region (the point). Now all of the initial wave energy is concentrated in a relatively small area off of the point, creating large, high energy waves (Figure 3.3.6). In the bay, the refraction has caused the wave fronts to refract away from each other, dispersing the wave energy, and leading to calmer water and smaller waves. This makes the large waves of a “point break” ideal for surfing, while water is calmer in a bay, which is where people would launch a boat. This difference in wave energy also explains why there is net erosion on points, while sand and sediments get deposited in bays (see section 5.3).
By Paul Webb, used under a CC-BY 4.0 international license. Download this book for free at https://rwu.pressbooks.pub/webboceanography/front-matter/preface/
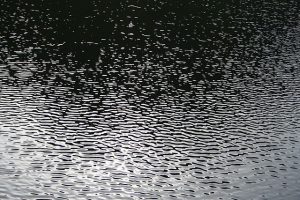
Most ocean waves are generated by wind. Wind blowing across the water's surface creates little disturbances called capillary waves, or ripples that start from gentle breezes (Figure 3.2.1). Capillary waves have a rounded crest with a V-shaped trough, and wavelengths less than 1.7 cm. These small ripples give the wind something to "grip" onto to generate larger waves when the wind energy increases, and once the wavelength exceeds 1.7 cm the wave transitions from a capillary wave to a wind wave. As waves are produced, they are opposed by a restoring force that attempts to return the water to its calm, equilibrium condition. The restoring force of the small capillary waves is surface tension, but for larger wind-generated waves gravity becomes the restoring force.
As the energy of the wind increases, so does the size, length and speed of the resulting waves. There are three important factors determining how much energy is transferred from wind to waves, and thus how large the waves will get:
- Wind speed.
- The duration of the wind, or how long the wind blows continuously over the water.
- The distance over which the wind blows across the water in the same direction, also known as the fetch.
Increasing any of these factors increases the energy of wind waves, and therefore their size and speed. But there is an upper limit to how large wind-generated waves can get. As wind energy increases, the waves receive more energy and they get both larger and steeper (recall from section 3.1 that wave steepness = height/wavelength). When the wave height exceeds 1/7 of the wavelength, the wave becomes unstable and collapses, forming whitecaps.
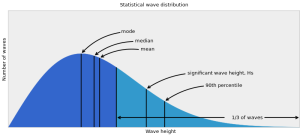
The ocean surface represents an irregular mixture of hundreds of waves of different speeds and sizes, all coming from different directions and interacting with each other. A histogram of wave heights within this mixture reveals a bell-shaped curve (Figure 3.2.2). In addition to basic statistics such as mode (most probable), median and mean wave height, wave heights are also reported in other ways. Marine weather forecasts and ship and buoy data often report significant wave height (Hs), which is the mean height of the largest one-third of the waves. Mean wave height is approximately equal to two-thirds of the significant wave height. Finally, there is the minimum height of the highest 10% of waves (the 90th percentile of wave heights), often expressed as H1/10.
Under strong wind conditions, the ocean surface becomes a chaotic mixture of choppy, whitecapped wind-generated waves. The term sea state describes the size and extent of the wind-generated waves in a particular area. When the waves are at their maximum size for the existing wind speed, duration, and fetch, it is referred to as a fully developed sea. The sea state is often reported on the Beaufort scale, ranging from 0-12, where 0 means calm, windless and waveless conditions, while Beaufort 12 is a hurricane (see box below).
The Beaufort Scale
The Beaufort scale is used to describe the wind and sea state conditions on the ocean. It is an observational scale based on the judgement of the observer, rather than one dictated by accurate measurements of wave height. Beaufort 0 represents calm, flat conditions, while Beaufort 12 represents a hurricane.


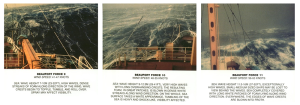
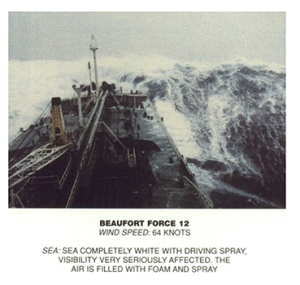
(Images by United States National Weather Service (http://www.crh.noaa.gov/mkx/marinefcst.php) [Public domain], via Wikimedia Commons).
A fully developed sea often occurs under stormy conditions, where high winds create a chaotic, random pattern of waves and whitecaps of varying sizes. The waves will propagate outwards from the center of the storm, powered by the strong winds. However, as the storm subsides and the winds weaken, these irregular seas will sort themselves out into more ordered patterns. Recall that open ocean waves will usually be deep water waves, and their speed will depend on their wavelength (section 3.1). As the waves move away from the storm center, they sort themselves out based on speed, with longer wavelength waves traveling faster than shorter wavelength waves. This means that eventually all of the waves in a particular area will be traveling with the same wavelength, creating regular, long period waves called swell (Figure 3.2.3). We experience swell as the slow up and down or rocking motion we feel on a boat, or with the regular arrival of waves on shore. Swell can travel very long distances without losing much energy, so we can observe large swells arriving at the shore even where there is no local wind; the waves were produced by a storm far offshore, and were sorted into swell as they traveled towards the coast.
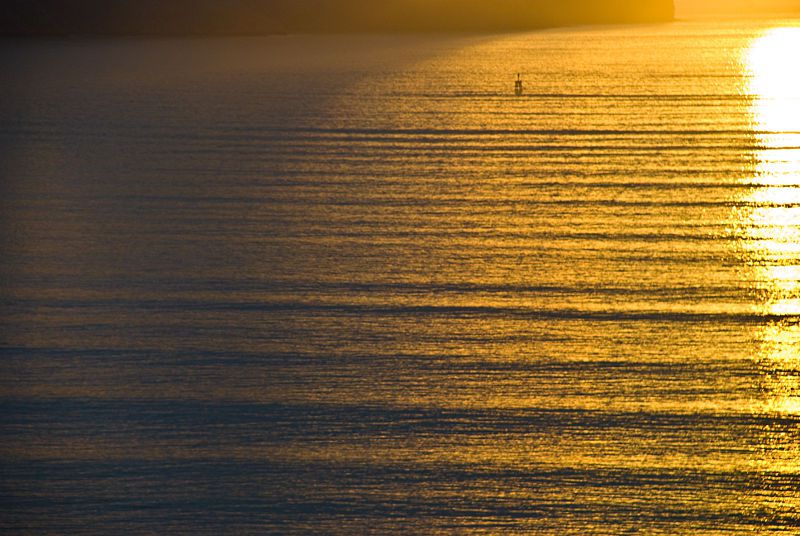
Figure 3.2.3 Ocean swell, the regular pattern of waves of equal wavelength (Phillip Capper [CC BY 2.0], via Wikimedia Commons).
Because swell travels such long distances, eventually swells coming from different directions will run into each other, and when they do they create interference patterns. The interference pattern is created by adding the features of the waves together, and the type of interference that is created depends on how the waves interact with each other (Figure 3.2.4). Constructive interference occurs when the two waves are completely in phase; the crest of one wave lines up exactly with the crest of the other wave, as do the troughs of the two waves. Adding the two crest together creates a crest that is higher than in either of the source waves, and adding the troughs creates a deeper trough than in the original waves. The result of constructive interference is therefore to create waves that are larger than the original source waves. In destructive interference, the waves interact completely out of phase, where the crest of one wave aligns with the trough of the other wave. In this case, the crest and the trough work to cancel each other out, creating a wave that is smaller than either of the source waves. In reality, it is rare to find perfect constructive or destructive interference as displayed in Figure 3.2.4. Most interference by swells at sea is mixed interference, which contains a mix of both constructive and destructive interference. The interacting swells do not have the same wavelength, so some points show constructive interference, and some points show destructive interference, to varying degrees. This results in an irregular pattern of both small and large waves, called surf beat.
It is important to point out that these interference patterns are only temporary disturbances, and do not affect the properties of the source waves. Moving swells interact and create interference where they meet, but each wave continues on unaffected after the swells pass each other.

About half of the waves in the open sea are less than 2 m high, and only 10-15% exceed 6 m. But the ocean can produce some extremely large waves. The largest wind wave reliably measured at sea occurred in the Pacific Ocean in 1935, and was measured by the navy tanker the USS Ramapo. Its crew measured a wave of 34 m or about 112 ft high! Occasionally constructive interference will produce waves that are exceptionally large, even when all of the surrounding waves are of normal height. These random, large waves are called rogue waves (Figure 3.2.5). A rogue wave is usually defined as a wave that is at least twice the size of the significant wave height, which is the average height of the highest one-third of waves in the region. It is not uncommon for rogue waves to reach heights of 20 m or more.

Figure 3.2.5 A rogue wave in the Bay of Biscay, off of the French coast, ca. 1940 (NOAA, [Public domain], via Wikimedia Commons).
Rogue waves are particularly common off of the southeast coast of South Africa, a region referred to as the "wild coast." Here, Antarctic storm waves move north into the oncoming Agulhas Current, and the wave energy gets focused over a narrow area, leading to constructive interference. This area may be responsible for sinking more ships than anywhere else on Earth. On average about 100 ships are lost every year across the globe, and many of these losses are probably due to rogue waves.
Waves in the Southern Ocean are generally fairly large (the red areas in Figure 3.2.6) because of the strong winds and the lack of landmasses, which provide the winds with a very long fetch, allowing them to blow unimpeded over the ocean for very long distances. These latitudes have been termed the “Roaring Forties”, “Furious Fifties”, and “Screaming Sixties” due to the high winds.


