31 4.7 Sea Level Change
Sea level change has been a feature on Earth for billions of years, and it has important implications for coastal processes, estuaries, and both erosional and depositional features. There are two main mechanisms of sea level change, eustatic and isostatic, as described below.
Eustatic sea level changes are global sea level changes related to changes in the volume of water in the ocean. These can be due to changes in the volume of glacial ice on land, thermal expansion of the water, or to changes in the shape of the seafloor caused by plate tectonic processes. For example, seafloor spreading widens an ocean basin, thus changing its volume and affecting sea level.
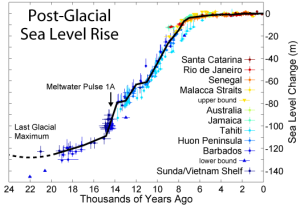
Over the past 20,000 years, there has been approximately 125 m of eustatic sea level rise due to glacial melting. Most of that took place between 15,000 and 7,500 years ago during the major melting phase of the North American and Eurasian Ice Sheets (Figure 4.7.1). At around 7,500 years ago, the rate of glacial melting and sea level rise decreased dramatically, and since that time, the average rate has been in the order of 0.7 mm/year.
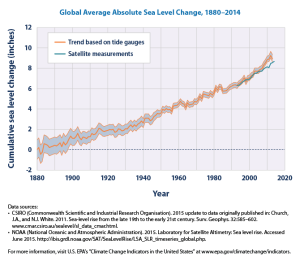
Anthropogenic climate change led to accelerating sea level rise starting around 1870. Since that time, the average rate has been 1.1 mm/year, but it has been gradually increasing. Since 1992, the average rate has been 3.2 mm/year (Figure 4.7.2). Much of this is due to increased glacial melting as the global climate gets warmer, but a large part is due to thermal expansion of the water. As water warms, the molecules gain more kinetic energy and move faster and farther apart; the result is that the same amount of water now takes up more space. So even without the input of new water from melting ice, warming ocean temperatures will cause sea level to rise.
Isostatic sea level changes are local changes caused by subsidence or uplift of the crust related either to changes in the amount of ice on the land, or to growth or erosion of mountains. Almost all of Canada and parts of the northern United States were covered in thick ice sheets at the peak of the last glaciation. Following the melting of this ice, there has been an isostatic rebound of continental crust in many areas. This ranges from several hundred meters of rebound in the central part of the Laurentide Ice Sheet (around Hudson Bay) to 100 m to 200 m in places such as Vancouver Island and the mainland coast of British Columbia. In other words, although global sea level was about 130 m lower during the last glaciation, the glaciated regions were depressed at least that much in most places, and more than that in places where the ice was thickest. Tectonic processes, such as the uplift of crust, can also cause localized changes in sea level.
By Paul Webb, used under a CC-BY 4.0 international license. Download this book for free at https://rwu.pressbooks.pub/webboceanography/front-matter/preface/
Modified from “Physical Geology” by Steven Earle used under a CC-BY 4.0 international license. Download this book for free at http://open.bccampus.ca
If you look at a map of Earth, you may notice that some of the continents seem to fit together. An early reference to this phenomenon came from Francis Bacon in the 17th century, who noticed the similarities in the Atlantic coasts of Africa, and North and South America. This apparent fit is due to the fact the continents were once connected, and have since moved apart in what has been called continental drift. However, we now know that it is not just the continents that move, so a more correct term is plate tectonics. We can credit Alfred Wegener (Figure 2.1.1) as the originator of this idea.
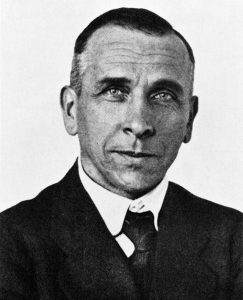
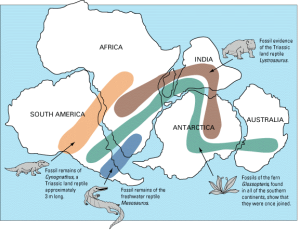
Alfred Wegener (1880-1930) earned a PhD in astronomy at the University of Berlin in 1904, but he had always been interested in geophysics and meteorology and spent most of his academic career working in meteorology. In 1911 he happened on a scientific publication that included a description of the existence of matching Permian-aged terrestrial fossils in various parts of South America, Africa, India, Antarctica, and Australia (Figure 2.1.2). Wegener concluded that this distribution of fossils could only exist if these continents were joined together. Furthermore, some of these transcontinental areas have similar fossils until around 150 million years ago, then they begin to diverge, suggesting that the areas eventually separated and speciation took different paths on the separate continents. Wegener coined the term Pangaea (“all land”) for the supercontinent from which all of the present-day continents diverged.
Wegener pursued his theory with determination — combing the libraries, consulting with colleagues, and making observations — looking for evidence to support it. In addition to the fit of the continents and the fossil evidence, Wegener relied heavily on matching geological patterns across oceans, such as sedimentary strata in South America matching those in Africa (Fig. 2.1.3), North American coalfields matching those in Europe, and the mountains of Atlantic Canada matching those of northern Britain both in morphology and rock type.

Wegener also referred to the evidence for the Carboniferous and Permian (~300 Ma) Karoo Glaciation in South America, Africa, India, Antarctica, and Australia (Fig. 2.1.4). These areas contain evidence of past glacial deposits, including glacial scars oriented away from the poles, despite the fact that some of these locations are now tropical environments. This indicates that these continents were once closer to the south pole where the glaciers could have formed. Wegener argued that this could only have happened if these continents were once all connected as a single supercontinent. He also cited evidence (based on his own astronomical observations) that showed that the continents were moving with respect to each other, and determined a separation rate between Greenland and Scandinavia of 11 m per year, although he admitted that the measurements were not accurate. In fact they weren’t even close — the separation rate is actually about 2.5 cm per year!

Wegener first published his ideas in 1912 in a short book called Die Entstehung der Kontinente (The Origin of Continents), and then in 1915 in Die Entstehung der Kontinente und Ozeane (The Origin of Continents and Oceans). He revised this book several times up to 1929, and it was translated into French, English, Spanish, and Russian. However, despite his range of evidence, the continental fits were not perfect and the geological match-ups were not always consistent (while the continental fit left some gaps when using the current coastline, it was demonstrated in the 1960s that using a 500 m depth contour gives a much tighter fit). But the most serious problem of all was that Wegener could not conceive of a good mechanism for moving the continents around. Wegener proposed that the continents were like icebergs floating on heavier crust, but the only forces that he could invoke to propel continents around were poleflucht, the effect of Earth’s rotation pushing objects toward the equator, and the lunar and solar tidal forces, which tend to push objects toward the west. It was quickly shown that these forces were far too weak to move continents, and without any reasonable mechanism to make it work, Wegener’s theory was quickly dismissed by most geologists of the day. Alfred Wegener died in Greenland in 1930 while carrying out studies related to glaciation and climate. At the time of his death, his ideas were tentatively accepted by only a small minority of geologists, and soundly rejected by most. However, within a few decades that was all to change.
Additional links for more information:
- For more about Wegener and the other pioneers of plate tectonics, visit The Geological Society's Plate Tectonics site: https://www.geolsoc.org.uk/Plate-Tectonics/Chap1-Pioneers-of-Plate-Tectonics
If you look at a map of Earth, you may notice that some of the continents seem to fit together. An early reference to this phenomenon came from Francis Bacon in the 17th century, who noticed the similarities in the Atlantic coasts of Africa, and North and South America. This apparent fit is due to the fact the continents were once connected, and have since moved apart in what has been called continental drift. However, we now know that it is not just the continents that move, so a more correct term is plate tectonics. We can credit Alfred Wegener (Figure 2.1.1) as the originator of this idea.

Alfred Wegener (1880-1930) earned a PhD in astronomy at the University of Berlin in 1904, but he had always been interested in geophysics and meteorology and spent most of his academic career working in meteorology. In 1911 he happened on a scientific publication that included a description of the existence of matching Permian-aged terrestrial fossils in various parts of South America, Africa, India, Antarctica, and Australia (Figure 2.1.2). Wegener concluded that this distribution of fossils could only exist if these continents were joined together. Furthermore, some of these transcontinental areas have similar fossils until around 150 million years ago, then they begin to diverge, suggesting that the areas eventually separated and speciation took different paths on the separate continents. Wegener coined the term Pangaea (“all land”) for the supercontinent from which all of the present-day continents diverged.

Wegener pursued his theory with determination — combing the libraries, consulting with colleagues, and making observations — looking for evidence to support it. In addition to the fit of the continents and the fossil evidence, Wegener relied heavily on matching geological patterns across oceans, such as sedimentary strata in South America matching those in Africa (Fig. 2.1.3), North American coalfields matching those in Europe, and the mountains of Atlantic Canada matching those of northern Britain both in morphology and rock type.
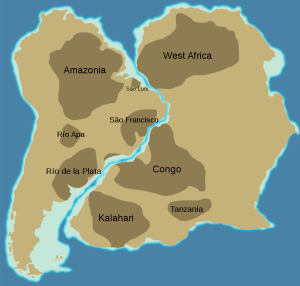
Wegener also referred to the evidence for the Carboniferous and Permian (~300 Ma) Karoo Glaciation in South America, Africa, India, Antarctica, and Australia (Fig. 2.1.4). These areas contain evidence of past glacial deposits, including glacial scars oriented away from the poles, despite the fact that some of these locations are now tropical environments. This indicates that these continents were once closer to the south pole where the glaciers could have formed. Wegener argued that this could only have happened if these continents were once all connected as a single supercontinent. He also cited evidence (based on his own astronomical observations) that showed that the continents were moving with respect to each other, and determined a separation rate between Greenland and Scandinavia of 11 m per year, although he admitted that the measurements were not accurate. In fact they weren’t even close — the separation rate is actually about 2.5 cm per year!
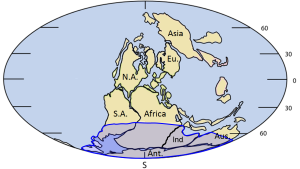
Wegener first published his ideas in 1912 in a short book called Die Entstehung der Kontinente (The Origin of Continents), and then in 1915 in Die Entstehung der Kontinente und Ozeane (The Origin of Continents and Oceans). He revised this book several times up to 1929, and it was translated into French, English, Spanish, and Russian. However, despite his range of evidence, the continental fits were not perfect and the geological match-ups were not always consistent (while the continental fit left some gaps when using the current coastline, it was demonstrated in the 1960s that using a 500 m depth contour gives a much tighter fit). But the most serious problem of all was that Wegener could not conceive of a good mechanism for moving the continents around. Wegener proposed that the continents were like icebergs floating on heavier crust, but the only forces that he could invoke to propel continents around were poleflucht, the effect of Earth’s rotation pushing objects toward the equator, and the lunar and solar tidal forces, which tend to push objects toward the west. It was quickly shown that these forces were far too weak to move continents, and without any reasonable mechanism to make it work, Wegener’s theory was quickly dismissed by most geologists of the day. Alfred Wegener died in Greenland in 1930 while carrying out studies related to glaciation and climate. At the time of his death, his ideas were tentatively accepted by only a small minority of geologists, and soundly rejected by most. However, within a few decades that was all to change.
Additional links for more information:
- For more about Wegener and the other pioneers of plate tectonics, visit The Geological Society's Plate Tectonics site: https://www.geolsoc.org.uk/Plate-Tectonics/Chap1-Pioneers-of-Plate-Tectonics
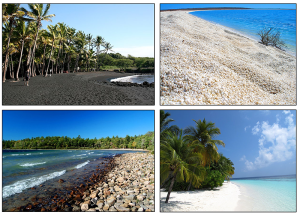
For most people, when they think of coastal areas they picture a beach, and the beach that they imagine is probably a typical sandy beach composed of quartz sand grains. But beaches are comprised of whatever types of sediments are dominant in the local area. For example, parts of Hawaii and Iceland are famous for their black sand beaches, made up of eroded basalt and other volcanic materials. The beautiful tropical white sand beaches we see in travel ads are largely composed of the crushed calcium carbonate remains of coral skeletons (much of which has been chewed up and excreted by a fish before we happily run our toes through it!) Other beaches may lack sand altogether and instead be dominated by small shells, or larger rocks or pebbles (Figure 4.1.1).
The shoreline is divided up into multiple zones (Figure 4.1.2). The backshore is the region of the beach above the high tide line, which is only submerged under unusually high wave conditions, such as during storms. The foreshore lies between the high tide and low tide lines; it is submerged during high tide and is exposed during low tide. The nearshore extends from the low tide line to the depth where wave action is no longer influenced by the bottom, i.e. to where the depth exceeds the wave base (section 3.1). Finally, the offshore zone represents the depths beyond the nearshore region.
Along the beach itself, the area above the high tide line is called the berm, which is usually dry and relatively flat. The berm often ends with a berm crest or berm scarp, which is a steeper wall carved out by wave action that leads down to the foreshore. The foreshore has a number of other names, including the beach face, the intertidal or littoral zone, and if the area is fairly flat, the low tide terrace. Just off shore from the beach there are often longshore bars and longshore troughs running parallel to the beach. The longshore bars are accumulations of sand that are deposited by wave action and longshore currents (section 4.2). The decrease in depth above longshore bars is what often causes waves to start to break well before reaching the beach (section 3.3).
The sand or other particles that make up the beach are distributed by wave action. The water that moves over a beach through incoming waves is called swash, and it also contains suspended sand grains that can get deposited on the beach. Some of the swash percolates into the sand while the rest of the water washes back out as backwash as the wave recedes. Backwash removes sand from the beach and returns it to the ocean. Sand will therefore be deposited or eroded depending on which process is dominant. If wave action is light, a lot of incoming water gets absorbed by the sand, so swash dominates. Under heavier waves the beach becomes saturated with water, so less can be absorbed, and backwash is dominant. This leads to seasonal cycles in beach structure; waves are heavier during the winter as a result of stormier conditions at sea, so backwash dominates and sand is removed from the beach and deposited offshore in longshore bars. In the summer the waves are gentler, swash dominates, and the sand is transported from the longshore bar and deposited on the shore to create a wider, sandy beach (Figure 4.1.3).

By Paul Webb, used under a CC-BY 4.0 international license. Download this book for free at https://rwu.pressbooks.pub/webboceanography/front-matter/preface/
Major types of ocean pollution include:
* Petroleum
* Sewage
* Solid Waste
* Heavy metals and toxic chemical compounds.
Critical factors relating to ocean pollution:
*There are many ways these substance end up in the ocean ranging from intentional dumping, acts of ignorance, to impacts of disasters (natural and otherwise).
* The majority of pollutants come from land. According to NOAA studies, about 80 percent of marine pollution comes from sources on land.
* Man-made products become pollution when exposed to natural processes that move them through the natural environment. Materials like paper and metals typically decay, but plastic and glass can survive indefinitely. Plastic bags, nets, and fishing lines can trap, injure, and strangle marine creatures. Small plastic objects are consumed and block digestion. Inks, dyes, metals, and toxins from cigarette butts can poison sea life on all tropic levels.
From Miracosta College, is shared under a not declared license and was authored, remixed, and/or curated by LibreTexts. Download this book for free at https://geo.libretexts.org/Bookshelves/Oceanography/Oceanography_101_(Miracosta)
Oxygen and carbon dioxide are involved in the same biological processes in the ocean, but in opposite ways; photosynthesis consumes CO2 and produces O2, while respiration and decomposition consume O2 and produce CO2. Therefore it should not be surprising that oceanic CO2 profiles are essentially the opposite of dissolved oxygen profiles (Figure 5.5.1). At the surface, photosynthesis consumes CO2 so CO2 levels remain relatively low. In addition, organisms that utilize carbonate in their shells are common near the surface, further reducing the amount of dissolved CO2.
In deeper water, CO2 concentration increases as respiration exceeds photosynthesis, and decomposition of organic matter adds additional CO2 to the water. As with oxygen, there is often more CO2 at depth because cold bottom water holds more dissolved gases, and high pressures increase solubility. Deep water in the Pacific contains more CO2 than the Atlantic as the Pacific water is older and has accumulated more CO2 from the respiration of benthic organisms.
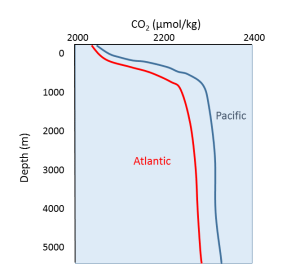
But the behavior of carbon dioxide in the ocean is more complex than the figure above would suggest. When CO2 gas dissolves in the ocean, it interacts with the water to produce a number of different compounds according to the reaction below:
CO2 + H2O ↔ H2CO3 ↔ H+ + HCO3- ↔ 2H+ + CO32-
CO2 reacts with water to produce carbonic acid (H2CO3), which then dissociates into bicarbonate (HCO3-) and hydrogen ions (H+). The bicarbonate ions can further dissociate into carbonate (CO32-) and additional hydrogen ions (Figure 5.5.2).

Most of the CO2 dissolving or produced in the ocean is quickly converted to bicarbonate. Bicarbonate accounts for about 92% of the CO2 dissolved in the ocean, and carbonate represents around 7%, so only about 1% remains as CO2, and little gets absorbed back into the air. The rapid conversion of CO2 into other forms prevents it from reaching equilibrium with the atmosphere, and in this way, water can hold 50-60 times as much CO2 and its derivatives as the air.
CO2 and pH
The equation above also illustrates carbon dioxide's role as a buffer, regulating the pH of the ocean. Recall that pH reflects the acidity or basicity of a solution. The pH scale runs from 0-14, with 0 indicating a very strong acid, and 14 representing highly basic conditions. A solution with a pH of 7 is considered neutral, as is the case for pure water. The pH value is calculated as the negative logarithm of the hydrogen ion concentration according to the equation:
pH = -log10[H+]
Therefore, a high concentration of H+ ions leads to a low pH and acidic condition, while a low H+ concentration indicates a high pH and basic conditions. It should also be noted that pH is described on a logarithmic scale, so every one point change on the pH scale actually represents an order of magnitude (10 x) change in solution strength. So a pH of 6 is 10 times more acidic than a pH of 7, and a pH of 5 is 100 times (10 x 10) more acidic than a pH of 7.
Carbon dioxide and the other carbon compounds listed above play an important role in buffering the pH of the ocean. Currently, the average pH for the global ocean is about 8.1, meaning seawater is slightly basic. Because most of the inorganic carbon dissolved in the ocean exists in the form of bicarbonate, bicarbonate can respond to disturbances in pH by releasing or incorporating hydrogen ions into the various carbon compounds. If pH rises (low [H+]), bicarbonate may dissociate into carbonate, and release more H+ ions, thus lowering pH. Conversely, if pH gets too low (high [H+]), bicarbonate and carbonate may incorporate some of those H+ ions and produce bicarbonate, carbonic acid, or CO2 to remove H+ ions and raise the pH. By shuttling H+ ions back and forth between the various compounds in this equation, the pH of the ocean is regulated and conditions remain favorable for life.
CO2 and Ocean Acidification
In recent years there has been rising concern about the phenomenon of ocean acidification. As described in the processes above, the addition of CO2 to seawater lowers the pH of the water. As anthropogenic sources of atmospheric CO2 have increased since the Industrial Revolution, the oceans have been absorbing an increasing amount of CO2, and researchers have documented a decline in ocean pH from about 8.2 to 8.1 in the last century. This may not appear to be much of a change, but remember that since pH is on a logarithmic scale, this decline represents a 30% increase in acidity. It should be noted that even at a pH of 8.1 the ocean is not actually acidic; the term "acidification" refers to the fact that the pH is becoming lower, i.e. the water is moving towards more acidic conditions.
Figure 5.5.3 presents data from observation stations in and around the Hawaiian Islands. As atmospheric levels of CO2 have increased, the CO2 content of the ocean water has also increased, leading to a reduction in seawater pH. Some models suggest that at the current rate of CO2 addition to the atmosphere, by 2100 ocean pH may be further reduced to around 7.8, which would represent more than a 120% increase in ocean acidity since the Industrial Revolution.

Why is this important? Declining pH can impact many biological systems. Of particular concern are organisms that secrete calcium carbonate shells or skeletons, such as corals, shellfish, and may planktonic organisms. At lower pH levels, calcium carbonate dissolves, eroding the shells and skeletons of these organisms (Figure 5.5.4).

Not only does a declining pH lead to increased rates of dissolution of calcium carbonate, it also diminishes the amount of free carbonate ions in the water. The relative proportions of the different carbon compounds in seawater is dependent on pH (Figure 5.5.6). As pH declines, the amount of carbonate declines, so there is less available for organisms to incorporate into their shells and skeletons. So ocean acidification both dissolves existing shells and makes it harder for shell formation to occur.

Additional links for more information:
- NOAA Ocean Acidification Program website http://oceanacidification.noaa.gov/
Written by Dr. Cristina Cardona.
Waves generally begin as a disturbance of some kind, and the energy of that disturbance gets propagated in the form of waves. We are most familiar with the kind of waves that break on shore, or rock a boat at sea, but there are many other types of waves that are important to oceanography:
- Internal waves form at the boundaries of water masses of different densities (i.e. at a pycnocline), and propagate at depth. These generally move more slowly than surface waves, and can be much larger, with heights exceeding 100 m. However, the height of the deep wave would be unnoticeable at the surface.
- Tidal waves are due to the movement of the tides. What we think of as tides are basically enormously long waves with a wavelength that may span half the globe (see section 4.1). Tidal waves are not related to tsunamis, so don’t confuse the two.
- Tsunamis are large waves created as a result of earthquakes or other seismic disturbances. They are also called seismic sea waves (section 3.4).
- Splash waves are formed when something falls into the ocean and creates a splash. The giant wave in Lituya Bay that was described in the introduction to this chapter was a splash wave.
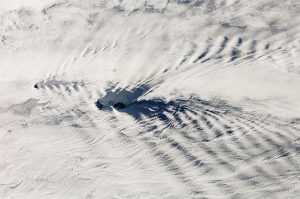
- Atmospheric waves form in the sky at the boundary between air masses of different densities. These often create ripple effects in the clouds (Figure 3.1.1).
There are several components to a basic wave (Figure 3.1.2):
- Still water level: where the water surface would be if there were no waves present and the sea was completely calm.
- Crest: the highest point of the wave.
- Trough: the lowest point of the wave.
- Wave height: the distance between the crest and the trough.
- Wavelength: the distance between two identical points on successive waves, for example crest to crest, or trough to trough.
- Wave steepness: the ratio of wave height to length (H/L). If this ratio exceeds 1/7 (i.e. height exceeds 1/7 of the wavelength) the wave gets too steep, and will break.

There are also a number of terms used to describe wave motion:
- Period: the time it takes for two successive crests to pass a given point.
- Frequency: the number of waves passing a point in a given amount of time, usually expressed as waves per second. This is the inverse of the period.
- Speed: how fast the wave travels, or the distance traveled per unit of time. This is also called celerity (c), where
c = wavelength x frequency
Therefore, the longer the wavelength, the faster the wave.
Although waves can travel over great distances, the water itself shows little horizontal movement; it is the energy of the wave that is being transmitted, not the water. Instead, the water particles move in circular orbits, with the size of the orbit equal to the wave height (Figure 3.1.3). This orbital motion occurs because water waves contain components of both longitudinal (side to side) and transverse (up and down) waves, leading to circular motion. As a wave passes, water moves forwards and up over the wave crests, then down and backwards into the troughs, so there is little horizontal movement. This is evident if you have ever watched an object such as a seabird floating at the surface. The bird bobs up and down as the wave pass underneath it; it does not get carried horizontally by a single wave crest.
Figure 3.1.3 Animation showing the orbital motion of particles in a surface wave (By Kraaiennest (Own work) [GFDL (http://www.gnu.org/copyleft/fdl.html) or CC BY-SA 4.0], via Wikimedia Commons).
The circular orbital motion declines with depth as the wave has less impact on deeper water and the diameter of the circles is reduced. Eventually at some depth there is no more circular movement and the water is unaffected by surface wave action. This depth is the wave base and is equivalent to half of the wavelength (Figure 3.1.4). Since most ocean waves have wavelengths of less than a few hundred meters, most of the deeper ocean is unaffected by surface waves, so even in the strongest storms marine life or submarines can avoid heavy waves by submerging below the wave base.
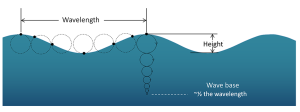
When the water below a wave is deeper than the wave base (deeper than half of the wavelength), those waves are called deep water waves. Most open ocean waves are deep water waves. Since the water is deeper than the wave base, deep water waves experience no interference from the bottom, so their speed only depends on the wavelength:
[latex]\text{speed (m/s)} = \sqrt{\frac{gL}{2\pi}}[/latex]
where g is gravity and L is wavelength in meters. Since g and π are constants, this can be simplified to:
[latex]\text{speed (m/s)} = 1.25\sqrt{L}[/latex]
Shallow water waves occur when the depth is less than 1/20 of the wavelength. In these cases, the wave is said to "touch bottom" because the depth is shallower than the wave base so the orbital motion is affected by the seafloor. Due to the shallow depth, the orbits are flattened, and eventually the water movement becomes horizontal rather than circular just above the bottom. The speed of shallow water waves depends only on the depth:
[latex]\text{speed (m/s)} = \sqrt{gd}[/latex]
where g is gravity and d is depth in meters. This can be simplified to:
[latex]\text{speed (m/s)} = 3.13\sqrt{d}[/latex]
Intermediate or transitional waves are found in depths between ½ and 1/20 of the wavelength. Their behavior is a bit more complex, as their speed is influenced by both wavelength and depth. The speed of an intermediate wave is calculated as:
which contains both depth and wavelength variables.
In addition to fish, the ocean is also home to a variety of birds. These birds are referred to as seabirds because they spend a considerable amount of time around the sea. Many seabirds spend their entire lives in the ocean, only coming to land to reproduce. Some seabirds dive and swim below the surface, such as penguins, whose wings are modified into flippers, or cormorants, whose webbed feet act as paddles. Others stay at the surface, only hunting in the uppermost meter of the water (Keddy). Please go to this website to read more about seabirds: https://ca.audubon.org/what-s-seabird
Birds evolved from reptilian ancestors
Birds split from the main reptile branch about 150 million years ago with an intermediate form known as Archaeopteryx, which was about the size of a crow. They have reptilian characteristics, such as their feet and lower legs are covered with scales and terminate in claws, their reproductive physiology is basically reptilian (laying eggs), their feathers are believed to have been derived from scales, and have many other developmental and structural similarities with reptiles. Yet, unlike reptiles, birds are warm-blooded (endothermic) and maintain a constant internal body temperature.
Marine birds
Marine birds tend to be larger and stronger than their land counterparts. They have a lightweight, low-density body structure with hollow bones. Their wings are long, pointed and cupped underneath to support a large and muscular organism aloft for long periods of time.
They do not drink freshwater. Instead, they have salt glands over their eyes that remove the salt, thus permitting them to drink seawater, freeing them from dependence on freshwater from the land. The salty fluid is expelled through their bills.
The albatross
- This is one of the largest of the oceanic birds, with a wingspan of up to 12 feet
- They are the best gliders in the world – may remain aloft for months at a time, taking advantage of the west wind drift (winds that blow completely around Antarctica)
Pelicans
- This prehistoric-looking bird feeds by diving on its prey and entrapping it in its large gular pouch
- It has air sacs in its shoulders that absorb the impact with the water
Arctic Terns
- This bird feeds on small fish swimming near the surface that it catches by diving. It may even swim below the surface after them
- It lives at high latitudes and breeds on all far north rocky coasts
- However, it dislikes cold weather, so makes the longest migration of any animal, 15,000 miles each way
Penguins
- Penguins are found only in the southern hemisphere
- They are flightless birds that "fly" through the water after fish, squid and krill
- They slow their heart rate
- Have subcutaneous fat layers for insulation
- Have heavy plumage for insulation
- Their bodies are streamlined
- They have heavy feet for paddling and kicking against the water
- Their blood is shunted to the heart and brain and the extremities are deprived of blood, in order to slow heat loss
- These apply to most diving birds
Emperor Penguin: These are the largest diving birds in the world, up to 4 ft in height
- They're the best bird divers in the world, can routinely dive for 5-10 minutes (most bird dives last 30 seconds to a minute) and at best can stay down for 15-18 minutes, diving to over 1000 feet
- They eat small fish and krill – penguin populations have increased as a result of the killing off of the great whales – more krill is available as food for penguins
Penguin Adaptations
- They fluff their feathers to create trapped air in a dead space
- They have long feathers
- They rock back and forth on their heels on the ice to limit the area in contact with the ice and slow heat loss
- They can reduce blood flow to and heat loss from their wings and feet
- They exhibit "huddle" behavior – gathering in large groups and constantly changing position so that each gets a turn in the center, where it's warmest
The first paragraph, by Keddy (University of California, Davis), is shared under a not declared license and was authored, remixed, and/or curated by LibreTexts. Download this book for free at https://geo.libretexts.org/Courses/Diablo_Valley_College/OCEAN-101%3A_Fundamentals_of_Oceanography_(Keddy)
The rest was written by Dr. Cristina Cardona.

