30 4.6 Estuaries
Estuaries are partially enclosed bodies of water where the salt water is diluted by fresh water input from land, creating brackish water with a salinity somewhere between fresh water and normal seawater. Estuaries include many bays, inlets, and sounds, and are often subject to large temperature and salinity variations due to their enclosed nature and smaller size compared to the open ocean.
Estuaries can be classified geologically into four basic categories based on their method of origin. In all cases they are a result of rising sea level over the last 18,000 years, beginning with the end of the last ice age; a period that has seen a rise of about 130 m. The rise in sea level has flooded coastal areas that were previously above water, and prevented the estuaries from being filled in by all of the sediments that have been emptied into them.
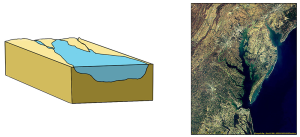
The first type is a coastal plain estuary, or drowned river valley. These estuaries are formed as sea level rises and floods an existing river valley, mixing salt and fresh water to create the brackish conditions where the river meets the sea. These types of estuaries are common along the east coast of the United States, including major bodies such as the Chesapeake Bay, Delaware Bay, and Narragansett Bay (Figure 4.6.1). Coastal plain estuaries are usually shallow, and since there is a lot of sediment input from the rivers, there are often a number of depositional features associated with them such as spits and barrier islands.
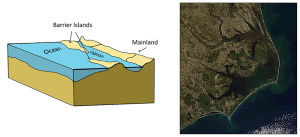
The presence of sand bars, spits, and barrier islands can lead to bar-built estuaries, where a barrier is created between the mainland and the ocean. The water that remains inside the sand bar is cut off from complete mixing with the ocean, and receives freshwater input from the mainland, creating estuarine conditions (Figure 4.6.2).
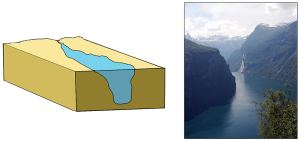
Fjords are estuaries formed in deep, U-shaped basins that were carved out by advancing glaciers. When the glaciers melted and retreated, sea level rose and filled these troughs, creating deep, steep-walled fjords (Figure 4.6.3). Fjords are common in Norway, Alaska, Canada, and New Zealand, where there are mountainous coastlines once covered by glaciers.
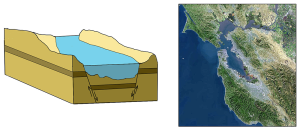
Tectonic estuaries are the result of tectonic movements, where faulting causes some sections of the crust to subside, and those lower elevation sections then get flooded with seawater. San Francisco Bay is an example of a tectonic estuary (Figure 4.6.4).
Estuaries are also classified based on their salinity and mixing patterns. The amount of mixing of fresh and salt water in an estuary depends on the rate at which fresh water enters the head of the estuary from river input, and the amount of seawater that enters the estuary mouth as a result of tidal movements. The input of fresh water is reflected in the flushing time of the estuary. This refers to the time it would take for the in-flowing fresh water to completely replace all the fresh water currently in the estuary. Seawater input is measured by the tidal volume, or tidal prism, which is the average volume of sea water entering and leaving the estuary during each tidal cycle. In other words, it is the volume difference between high and low tides. The interaction between the flushing time, tidal volume, and the shape of the estuary will determine the extent and type of water mixing within the estuary.
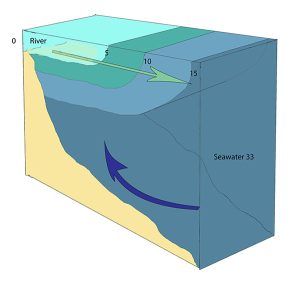
In a vertically mixed, or well-mixed estuary there is complete mixing of fresh and salt water from the surface to the bottom. In a particular location the salinity is constant at all depths, but across the estuary the salinity is lowest at the head where the fresh water enters, and is highest at the mouth, where the seawater comes in. This type of salinity profile usually occurs in shallower estuaries, where the shallow depths allow complete mixing from the surface to the bottom.
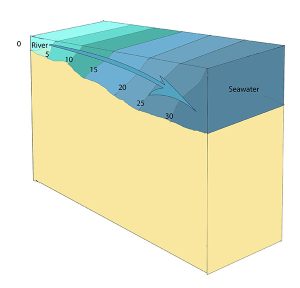
Slightly stratified or partially mixed estuaries have similar salinity profiles to vertically mixed estuaries, where salinity increases from the head to the mouth, but there is also a slight increase in salinity with depth at any point. This usually occurs in deeper estuaries than those that are well-mixed, where waves and currents mix the surface water, but the mixing may not extend all the way to the bottom.
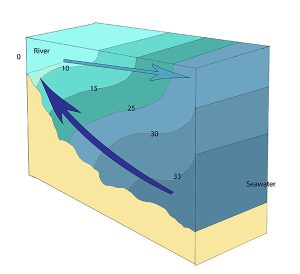
A salt wedge estuary occurs where the outflow of fresh water is strong enough to prevent the denser ocean water to enter through the surface, and where the estuary is deep enough that surface waves and turbulence have little mixing effect on the deeper water. Fresh water flows out along surface, salt water flows in at depth, creating a wedge shaped lens of seawater moving along the bottom. The surface water may remain mostly fresh throughout the estuary if there is no mixing, or it can become brackish depending on the level of mixing that occurs.
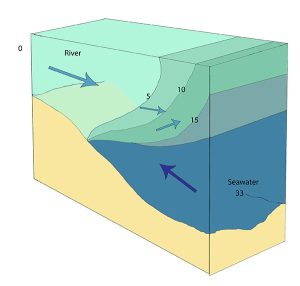
Highly stratified profiles are found in very deep estuaries, such as in fjords. Because of the depth, mixing of fresh and salt water only occurs near the surface, so in the upper layers salinity increases from the head to the mouth, but the deeper water is of standard ocean salinity.
Estuaries are very important commercially, as they are home to the majority of the world’s metropolitan areas, they serve as ports for industrial activity, and a large percentage of the world’s population lives near estuaries. Estuaries are also very important biologically, especially in their role as the breeding grounds for many species of fish, birds, and invertebrates.
By Paul Webb, used under a CC-BY 4.0 international license. Download this book for free at https://rwu.pressbooks.pub/webboceanography/front-matter/preface/
If you look at a map of Earth, you may notice that some of the continents seem to fit together. An early reference to this phenomenon came from Francis Bacon in the 17th century, who noticed the similarities in the Atlantic coasts of Africa, and North and South America. This apparent fit is due to the fact the continents were once connected, and have since moved apart in what has been called continental drift. However, we now know that it is not just the continents that move, so a more correct term is plate tectonics. We can credit Alfred Wegener (Figure 2.1.1) as the originator of this idea.

Alfred Wegener (1880-1930) earned a PhD in astronomy at the University of Berlin in 1904, but he had always been interested in geophysics and meteorology and spent most of his academic career working in meteorology. In 1911 he happened on a scientific publication that included a description of the existence of matching Permian-aged terrestrial fossils in various parts of South America, Africa, India, Antarctica, and Australia (Figure 2.1.2). Wegener concluded that this distribution of fossils could only exist if these continents were joined together. Furthermore, some of these transcontinental areas have similar fossils until around 150 million years ago, then they begin to diverge, suggesting that the areas eventually separated and speciation took different paths on the separate continents. Wegener coined the term Pangaea (“all land”) for the supercontinent from which all of the present-day continents diverged.
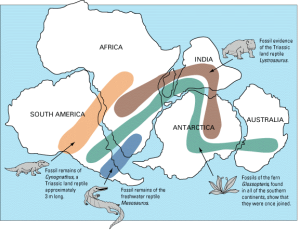
Wegener pursued his theory with determination — combing the libraries, consulting with colleagues, and making observations — looking for evidence to support it. In addition to the fit of the continents and the fossil evidence, Wegener relied heavily on matching geological patterns across oceans, such as sedimentary strata in South America matching those in Africa (Fig. 2.1.3), North American coalfields matching those in Europe, and the mountains of Atlantic Canada matching those of northern Britain both in morphology and rock type.

Wegener also referred to the evidence for the Carboniferous and Permian (~300 Ma) Karoo Glaciation in South America, Africa, India, Antarctica, and Australia (Fig. 2.1.4). These areas contain evidence of past glacial deposits, including glacial scars oriented away from the poles, despite the fact that some of these locations are now tropical environments. This indicates that these continents were once closer to the south pole where the glaciers could have formed. Wegener argued that this could only have happened if these continents were once all connected as a single supercontinent. He also cited evidence (based on his own astronomical observations) that showed that the continents were moving with respect to each other, and determined a separation rate between Greenland and Scandinavia of 11 m per year, although he admitted that the measurements were not accurate. In fact they weren’t even close — the separation rate is actually about 2.5 cm per year!

Wegener first published his ideas in 1912 in a short book called Die Entstehung der Kontinente (The Origin of Continents), and then in 1915 in Die Entstehung der Kontinente und Ozeane (The Origin of Continents and Oceans). He revised this book several times up to 1929, and it was translated into French, English, Spanish, and Russian. However, despite his range of evidence, the continental fits were not perfect and the geological match-ups were not always consistent (while the continental fit left some gaps when using the current coastline, it was demonstrated in the 1960s that using a 500 m depth contour gives a much tighter fit). But the most serious problem of all was that Wegener could not conceive of a good mechanism for moving the continents around. Wegener proposed that the continents were like icebergs floating on heavier crust, but the only forces that he could invoke to propel continents around were poleflucht, the effect of Earth’s rotation pushing objects toward the equator, and the lunar and solar tidal forces, which tend to push objects toward the west. It was quickly shown that these forces were far too weak to move continents, and without any reasonable mechanism to make it work, Wegener’s theory was quickly dismissed by most geologists of the day. Alfred Wegener died in Greenland in 1930 while carrying out studies related to glaciation and climate. At the time of his death, his ideas were tentatively accepted by only a small minority of geologists, and soundly rejected by most. However, within a few decades that was all to change.
Additional links for more information:
- For more about Wegener and the other pioneers of plate tectonics, visit The Geological Society's Plate Tectonics site: https://www.geolsoc.org.uk/Plate-Tectonics/Chap1-Pioneers-of-Plate-Tectonics
Waves generally begin as a disturbance of some kind, and the energy of that disturbance gets propagated in the form of waves. We are most familiar with the kind of waves that break on shore, or rock a boat at sea, but there are many other types of waves that are important to oceanography:
- Internal waves form at the boundaries of water masses of different densities (i.e. at a pycnocline), and propagate at depth. These generally move more slowly than surface waves, and can be much larger, with heights exceeding 100 m. However, the height of the deep wave would be unnoticeable at the surface.
- Tidal waves are due to the movement of the tides. What we think of as tides are basically enormously long waves with a wavelength that may span half the globe (see section 4.1). Tidal waves are not related to tsunamis, so don’t confuse the two.
- Tsunamis are large waves created as a result of earthquakes or other seismic disturbances. They are also called seismic sea waves (section 3.4).
- Splash waves are formed when something falls into the ocean and creates a splash. The giant wave in Lituya Bay that was described in the introduction to this chapter was a splash wave.
- Atmospheric waves form in the sky at the boundary between air masses of different densities. These often create ripple effects in the clouds (Figure 3.1.1).

There are several components to a basic wave (Figure 3.1.2):
- Still water level: where the water surface would be if there were no waves present and the sea was completely calm.
- Crest: the highest point of the wave.
- Trough: the lowest point of the wave.
- Wave height: the distance between the crest and the trough.
- Wavelength: the distance between two identical points on successive waves, for example crest to crest, or trough to trough.
- Wave steepness: the ratio of wave height to length (H/L). If this ratio exceeds 1/7 (i.e. height exceeds 1/7 of the wavelength) the wave gets too steep, and will break.

There are also a number of terms used to describe wave motion:
- Period: the time it takes for two successive crests to pass a given point.
- Frequency: the number of waves passing a point in a given amount of time, usually expressed as waves per second. This is the inverse of the period.
- Speed: how fast the wave travels, or the distance traveled per unit of time. This is also called celerity (c), where
c = wavelength x frequency
Therefore, the longer the wavelength, the faster the wave.
Although waves can travel over great distances, the water itself shows little horizontal movement; it is the energy of the wave that is being transmitted, not the water. Instead, the water particles move in circular orbits, with the size of the orbit equal to the wave height (Figure 3.1.3). This orbital motion occurs because water waves contain components of both longitudinal (side to side) and transverse (up and down) waves, leading to circular motion. As a wave passes, water moves forwards and up over the wave crests, then down and backwards into the troughs, so there is little horizontal movement. This is evident if you have ever watched an object such as a seabird floating at the surface. The bird bobs up and down as the wave pass underneath it; it does not get carried horizontally by a single wave crest.

The circular orbital motion declines with depth as the wave has less impact on deeper water and the diameter of the circles is reduced. Eventually at some depth there is no more circular movement and the water is unaffected by surface wave action. This depth is the wave base and is equivalent to half of the wavelength (Figure 3.1.4). Since most ocean waves have wavelengths of less than a few hundred meters, most of the deeper ocean is unaffected by surface waves, so even in the strongest storms marine life or submarines can avoid heavy waves by submerging below the wave base.

When the water below a wave is deeper than the wave base (deeper than half of the wavelength), those waves are called deep water waves. Most open ocean waves are deep water waves. Since the water is deeper than the wave base, deep water waves experience no interference from the bottom, so their speed only depends on the wavelength:
[latex]\text{speed (m/s)} = \sqrt{\frac{gL}{2\pi}}[/latex]
where g is gravity and L is wavelength in meters. Since g and π are constants, this can be simplified to:
[latex]\text{speed (m/s)} = 1.25\sqrt{L}[/latex]
Shallow water waves occur when the depth is less than 1/20 of the wavelength. In these cases, the wave is said to "touch bottom" because the depth is shallower than the wave base so the orbital motion is affected by the seafloor. Due to the shallow depth, the orbits are flattened, and eventually the water movement becomes horizontal rather than circular just above the bottom. The speed of shallow water waves depends only on the depth:
[latex]\text{speed (m/s)} = \sqrt{gd}[/latex]
where g is gravity and d is depth in meters. This can be simplified to:
[latex]\text{speed (m/s)} = 3.13\sqrt{d}[/latex]
Intermediate or transitional waves are found in depths between ½ and 1/20 of the wavelength. Their behavior is a bit more complex, as their speed is influenced by both wavelength and depth. The speed of an intermediate wave is calculated as:
[latex]\text{speed (m/s)} = \sqrt{\frac{gL}{2\pi}\tanh(2\pi{\frac{d}{L})}[/latex]
which contains both depth and wavelength variables.
Some coastal areas are dominated by erosion, an example being the Pacific coast of North America, while others are dominated by deposition, examples being the Atlantic and Caribbean coasts of the United States. But on almost all coasts, both deposition and erosion are happening to varying degrees most of the time, although in different places. On deposition-dominant coasts, the coastal sediments are still being eroded from some areas and deposited in others.
On coasts that are dominated by depositional processes, most of the sediment being deposited typically comes from large rivers. Much of the sediment is immediately deposited at the mouth of the river, creating large fan-shaped deltas. An obvious example is where the Mississippi River flows into the Gulf of Mexico at New Orleans; another is the Yellow (Huang He) River in China (Figure 4.4.1).

Figure 4.4.1 The Yellow River delta in China, created by one of the most sediment-laden rivers on Earth (NASA [Public domain], via Wikimedia Commons).
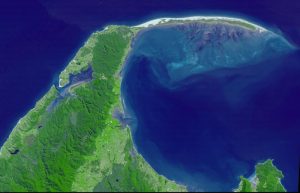

Tombolos are common where islands are abundant, and they typically form where there is a wave shadow behind a nearshore island (Figure 4.4.4). This becomes an area with reduced energy, and so the longshore current slows and sediments accumulate. Eventually enough sediments accumulate to connect the island to the mainland with a tombolo (Figure 4.4.5).


In areas where coastal sediments are abundant and coastal relief is low (because there has been little or no recent coastal uplift), it is common for barrier islands to form (Figure 4.4.6). Barrier islands are elongated islands composed of sand that form offshore from the mainland, potentially reaching several kilometers wide and hundreds of kilometers long. They are common along the U.S. Gulf Coast from Texas to Florida, and along the U.S. Atlantic Coast from Florida to Massachusetts. The islands often form as the result of sediment moving offshore through river discharge, while wave action works to push the sediment back towards the shore. The resulting sediment buildup is then stretched into long barrier islands by longshore transport.

Mature barrier islands contain a number of ecological zones. Beginning on the ocean side of the island there is a beach, consisting of the zones we discussed in section 4.1. Behind the beach lie dunes that are built up by sand transported by wind. The ocean side of the dunes are home to grasses and other plants which help stabilize the sand from erosion, and also help slow down the wind to allow sand to settle and accumulate. Beyond the dunes lies a more heavily vegetated barrier flat, covered by larger shrubs and trees that are tolerant to the high winds and salty conditions. As the land slopes down on the side of the island facing the mainland, the low-lying areas transition into a salt marsh or mud flat habitat, which is protected from wave action, but is influenced by tidal changes. The mud flats are colonized by grasses, which slow down the movement of water and lead to increased sediment deposition, building up the land in the marsh. Different species of grasses eventually dominate the different elevations of the salt marsh, depending on their tolerance for submersion in seawater. These salt marshes are very important habitats for many invertebrates, birds, and juvenile fish. Between the island and the mainland lies a lagoon, which usually contains brackish water from the mixing of fresh water runoff from the land and the seawater within a somewhat enclosed space. Barrier islands, although attractive locations for beach houses, are not permanent structures, and people should be wary of building on them. Over time, the erosion on the seaward side of the island, and the expansion of the marsh on the landward side, causes the island to slowly move towards the mainland, eventually closing off the lagoon. Maintaining dune grasses is one way to slow this movement, and as we will see in the next section, people have developed a number of other strategies to try to curtail the natural erosion of beaches.
By Paul Webb, used under a CC-BY 4.0 international license. Download this book for free at https://rwu.pressbooks.pub/webboceanography/front-matter/preface/
Modified from "Physical Geology" by Steven Earle used under a CC-BY 4.0 international license. Download this book for free at http://open.bccampus.ca
All of the salts and ions that dissolve in seawater contribute to its overall salinity. Salinity of seawater is usually expressed as the grams of salt per kilogram (1000 g) of seawater. On average, about 35 g of salt is present in each 1 kg of seawater, so we say that the average salinity of the ocean salinity is 35 parts per thousand (ppt). Note that 35 ppt is equivalent to 3.5% (parts per hundred). Some sources now use practical salinity units (PSU) to express salinity values, where 1 PSU = 1 ppt. The units are not included, so we can refer simply to a salinity of 35.
Many different substances are dissolved in the ocean, but six ions comprise about 99.4% of all the dissolved ions in seawater. These six major ions are (Table 5.3.1):
Table 5.3.1 The six major ions in seawater
| g/kg in seawater | % of ions by weight | |
|---|---|---|
| Chloride Cl- | 19.35 | 55.07% |
| Sodium Na+ | 10.76 | 30.6% |
| Sulfate SO42- | 2.71 | 7.72% |
| Magnesium Mg2+ | 1.29 | 3.68% |
| Calcium Ca2+ | 0.41 | 1.17% |
| Potassium K+ | 0.39 | 1.1% |
| 99.36% |
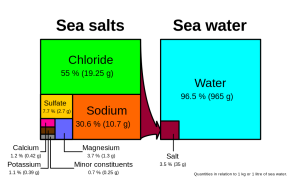
Chloride and sodium, the components of table salt (sodium chloride NaCl), make up over 85% of the ions in the ocean, which is why seawater tastes salty (Figure 5.3.1). In addition to the major constituents, there are numerous minor constituents; radionucleotides, organic compounds, metals etc. These minor constituents are found in concentrations of ppm (parts per million) or ppb (parts per billion), unlike the major ions that are far more abundant (ppt) (Table 5.3.2). To put this into perspective, 1 ppm = 1 mg/kg, or the equivalent of 1 teaspoon of sugar dissolved in 14,000 cans of soda. 1 ppb = 1 μg/kg, or the equivalent of 1 teaspoon of a substance dissolved in five Olympic-sized swimming pools! These minor constituents represent numerous substances, but together they make up less than 1% of the ions in the seawater. Some of these may be important as minerals and trace elements vital to living organisms, but they don’t have much impact on the overall salinity. But given the vast size of the oceans, even materials found in trace abundance can represent fairly large reservoirs. For example gold is a trace element in seawater, found in concentrations of parts per trillion, yet if you could extract all of the gold in just one km3 of seawater, it would be worth about $20 million!
Table 5.3.2 Concentrations of some minor elements in seawater
| g/kg in seawater | g/kg in seawater | ||
|---|---|---|---|
| Carbon | 0.028 | Iron | 2 x 10⁻⁶ |
| Nitrogen | 0.0115 | Manganese | 2 x 10⁻⁷ |
| Oxygen | 0.006 | Copper | 1 x 10⁻⁷ |
| Silicon | 0.002 | Mercury | 3 x 10⁻⁸ |
| Phosphorous | 6 x 10⁻⁵ | Gold | 4 x 10⁻⁹ |
| Uranium | 3.2 x 10⁻⁶ | Lead | 5 x 10⁻¹⁰ |
| Aluminum | 2 x 10⁻⁶ | Radon | 6 x 10-19 |
Because the six major ions in seawater comprise over 99% of the total salinity, changes in abundance of the minor constituents have little effect on overall salinity. Furthermore, the rule of constant proportions states that even though the absolute salinity of ocean water might differ in different places, the relative proportions of the six major ions within that water are always constant. For example, no matter the total salinity of a seawater sample, 55% of the total salinity will be due to chloride, 30% due to sodium, and so on. Since the proportion of these major ions does not change, we call these conservative ions.
Given these constant proportions, in order to calculate total salinity you can simply measure the concentration of just one of the major ions and use that value to calculate the rest. Traditionally chloride has been the ion measured because it is the most abundant, and thus the simplest to measure accurately. Multiplying the concentration of chloride by 1.8 gives the total salinity. For example, looking at Figure 5.3.1, 19.25 g/kg (ppt) chloride x 1.8 = 35 ppt. Today, for rapid measurements of salinity, electrical conductivity is often used rather than determining chloride concentrations (see box below).
Measuring salinity
There are a number of methods available for measuring the salinity of water. The most precise measurements utilize direct chemical analysis of the seawater in a lab setting, but there are a number of ways to get immediate salinity measurements in the field. For a quick estimate of salinity, a hand-held refractometer can be used (right).

This instrument measures the degree of bending, or refraction, of light rays as they pass through a fluid. The greater the amount of dissolved salts in the sample, the greater the degree of light refraction. The observer traps a drop of water on the blue screen, and looks through the eyepiece. The dividing line between the blue and white sections of the scale (inset) can be used to read the salinity.
For more accurate measurements, most oceanographers use an instrument that measures electrical conductivity. An electrical current is passed between two electrodes immersed in water, and the higher the salinity, the more readily the current will be conducted (the ions in seawater conduct electrical currents). Conductivity probes are often bundled into an instrument called a CTD, which stands for Conductivity, Temperature, and Depth, which are the most commonly-measured parameters. Modern CTDs can be outfitted with an array of probes measuring parameters like light, turbidity (water clarity), dissolved gases etc. CTDs can be large instruments (below), but small hand-held salinity probes are also widely available.

For large-scale salinity measurements, oceanographers can use satellites, such as the Aquarius satellite, which was able to measure surface salinity differences as small as 0.2 PSU as it mapped the ocean surface every seven days (below).
It is important to be aware that while the rule of constant proportions applies to most of the ocean, there may be certain coastal areas where lots of river discharge may alter these proportions slightly. Furthermore, it is important to remember that the rule of constant proportions only applies to the major ions. The proportions of the minor ions may fluctuate, but remember that they make a very minor contribution to overall salinity. Because the concentrations of the minor ions are not constant, these are referred to as non-conservative ions.
Why are the major ions found in constant proportions? There is constant input of ions from river runoff and other processes, usually in very different proportions from what is found in the ocean. So why don’t the proportions in the oceans change? Most of the ions discharged by rivers have fairly low residence times (see section 5.2) compared to ions in seawater, usually because they are used in biological processes. These low residence times do not allow the ions to accumulate and alter salinity. Also, the mixing time of the world ocean is around 1000 years, which is very short compared to the residence times of the major ions, which may be tens of millions of years long. So during the residence time of a single ion the ocean has mixed numerous times, and the major ions have become evenly distributed throughout the ocean.
Variations in Salinity
Total salinity in the open ocean averages 33-37 ppt, but it can vary significantly in different locations. But since the major ion proportions are constant, the regional salinity differences must be due more to water input and removal rather than the addition or removal of ions. Fresh water input comes through processes like precipitation, runoff from land, and melting ice. Fresh water removal primarily comes from evaporation and freezing (when seawater freezes, the resulting ice is mostly fresh water and the salts are excluded, making the remaining water even saltier). So differences in rates of precipitation, evaporation, river discharge, and ice formation play a significant role in regional salinity variations. For example, the Baltic Sea has a very low surface salinity of around 10 ppt, because it is a mostly enclosed body of water with lots of river input. Conversely, the Red Sea is very salty (around 40 ppt), due to the lack of precipitation and the hot environment which leads to high levels of evaporation.
One of the saltiest large bodies of water on Earth is the Dead Sea, between Israel and Jordan. Salinity in the Dead Sea is around 330 ppt, which is almost ten times saltier than the ocean. This extremely high salinity is a result of the hot, arid conditions in the Middle East that lead to high rates of evaporation. In addition, in the 1950s the flow from the Jordan River was diverted away from the Dead Sea, so there is no longer significant fresh water input. With no input and high evaporation, the water level in the Dead Sea is receding at a rate of about 1 m per year. The high salinity makes the water very dense, which creates buoyant forces that allow people to easily float at the surface. But the high salinity also means that the water is too salty for most living organisms, so only microbes are able to call it home; hence the name the Dead Sea. But as salty as the Dead Sea may be, it is not the saltiest body of water on Earth. That distinction currently belongs to Gaet’ale Pond in Ethiopia, with a salinity of 433 ppt!
Latitudinal Variations
While local conditions are important for determining salinity patterns in any single location, there are some global patterns that bear further investigation. Temperature is highest at the equator, and lowest near the poles, so we would expect higher rates of evaporation, and therefore higher salinity, in equatorial regions (Figure 5.3.2). This is generally the case, but in the figure below salinity right along the equator seems to be a little lower than at slightly higher latitudes. This is because equatorial regions also get a high volume of rain on a regular basis, which dilutes the surface water along the equator. So the higher salinities are found at subtropical, warm latitudes with high evaporation and less precipitation. At the poles there is little evaporation, which, coupled with ice and snow melting, produces a relatively low surface salinity. The image below shows high salinity in the Mediterranean Sea; this is located in a warm region with high evaporation, and the sea is largely isolated from mixing with the rest of the North Atlantic water, leading to high salinity. Lower salinities, such as those around southeast Asia, are the result of precipitation and high volumes of river input.

Figure 5.3.3 shows the mean global differences between evaporation and precipitation (evaporation - precipitation). Green colors represent areas where precipitation exceeds evaporation, while brown regions are where evaporation is greater than precipitations. Note the correlation between precipitation, evaporation, and surface salinity as seen in Figure 5.3.2.

Vertical Variation
In addition to geographical variation in salinity, there are also changes in salinity with depth. As we have seen, most differences in salinity are due to variations in evaporation, precipitation, runoff, and ice cover. All of these process occur at the ocean surface, not at depth, so the most pronounced differences in salinity should be found in surface waters. Salinity in deeper water remains relatively uniform, as it is unaffected by these surface processes. Some representative salinity profiles are shown in Figure 5.3.4. At the surface, the top 200 m or so show relatively uniform salinity in what is called the mixed layer. Winds, waves, and surface currents stir up the surface water, causing a great deal of mixing in this layer and fairly uniform salinity conditions. Below the mixed layer is an area of rapid salinity change over a small change in depth. This zone of rapid change is called the halocline, and it represents a transition between the mixed layer and the deep ocean. Below the halocline, salinity may show little variation down to the seafloor, as this region is far removed from the surface processes that impact salinity. In the figure below, note the low surface salinity at high latitudes, and higher surface salinity at low latitudes as discussed above. Yet despite the surface differences, salinity at depth in both locations may be very similar.

Eutrophication occurs when excess nutrients are introduced into a body of water. This process increases the rate of supply of organic matter in an ecosystem and stimulates aquatic plant growth. At normal levels, these nutrients feed the growth of organisms called cyanobacteria or algae. But with too many nutrients, cyanobacteria grow out of control. Excess algae block the sunlight needed by bottom-dwelling plants and lead to a decrease in oxygen in the water and consequently leads to negative outcomes.
Eutrophication occurs naturally but anthropogenic activities such as industrial effluent and runoff of fertilizers rich in nitrogen and phosphorus contribute heavily to eutrophication events. When supplied with an excess of nutrients, the algae can grow out of control. This event is known as an “algal bloom,” and disrupts the balance of the ecosystem. As described above, the increased growth blocks the availability of sunlight to benthic organisms and other plants and organisms in the photic zone. The overgrowth of algae eventually begins to die off and is broken down by microbes that consume oxygen during the decomposition process. This creates a hypoxic environment and decreases oxygen availability in the water to other organisms.
Some of the negative effects of this excessive algae production, or algal blooms, are:
- The production of dangerous toxins that can kill animals and people
- The creation of "dead zones" (low oxygen hypoxic zones, or no oxygen anoxic zones) in the ocean
- An increase in treatment costs for cleaning water
- Harm to industries and communities that rely on the affected watershed
The Eutrophication Process and how it leads to hypoxia. Source: https://www.wri.org/our-work/project/eutrophication-and-hypoxia/about-eutrophication
Multimedia - Khan Academy Video
The following link directs you to a video made by Khan Academy that explains the process of eutrophication and how dead zones are formed.
Sources of Eutrophication
Point source
A point source pollution is one that is directly identifiable and can be traced back to a singular distinguishable source. Factories and sewage treatment plants are the most common types of point sources that cause eutrophication. Some factories discharge their waste, called effluent, directly into a water body from sewage pipes. Unregulated discharge of effluent can cause severe damage to human health and the environment. The consequences of unregulated discharge include water pollution, unsafe drinking water, and restricted recreational activities. The sewage dump can deposit nutrients in streams that can be carried out to sea and cause eutrophication events. Symptoms caused by exposure to algal toxins in drinking water can include nausea, vomiting, and throat irritation. When water is consumed in sufficient quantities, the toxins can affect the liver and nervous system. This can also indirectly affect the economy because of the loss of working days due to such health problems.
Non-point source
Non-point source pollution is pollution where the origin is less specified and more diffuse. Non-point source pollution is difficult to remedy as the source cannot be pinpointed. Agricultural runoff is the largest non-point source cause of pollution leading to eutrophication in the Delta. More than 200 million pounds of pesticides are applied to California farms every year which are washed into the delta. Water runoff over landscapes with excess fertilizer can pick up nutrients and carry them out to bodies of water. Urban runoff is also considered a non-point source of pollution affecting eutrophication.
Hypoxia
Eutrophication can lead to hypoxia in the water column. Hypoxia event occurs when there is low oxygen level in the water. This incident is a consequence of eutrophication due to an excess of nutrient input (nitrogen and phosphorus) in the water that stimulates the growth of phytoplankton and consequently affects fishes and other organisms. Human activities have increased the rate of eutrophication through point source and non-point discharge of nutrients such as nitrogen and phosphorus.
Source: Gulf of Mexico Hypoxia https://gulfhypoxia.net/about-hypoxia/
As plant and animal biomass increase, species diversity decreases and the affected area will become overpopulated by phytoplankton feeding off the increased algae. This will also change the dominant biota in the region.
Turbidity is the clouding of water due to sediment. It can be caused by excessive phytoplankton, algae growth, urban runoff, or sediments from erosion. These suspended particles, in addition to making the water look dirty, also help promote the toxins in water as heavy metals and toxic organic compounds can attach easily to the suspended sediment. These suspended particles also absorb heat from the sun, making turbid waters warmer. This also reduces the oxygen content in the water, as more oxygen is dissolved in colder waters. The suspended particles also scatter light, decreasing the photosynthetic activity of plants and algae, which results in a positive feedback loop for decreasing oxygen even more. Some biological impacts include: fish eggs and larvae will be covered and suffocated, and gills will become clogged and damaged. Thus, turbidity is a plausible and extremely harmful effect of eutrophication.
Dead Zones
The Black Sea is one of the many dead zones that have been identified. The dead zone resulted from the contaminants from the Danube River which courses from Germany. During the 1960s to 1989, huge input to watersheds from several sources occurred. The nutrient sources are rising fossil fuel use and NOx input from atmospheric sources, intensive fertilizer use in farming practices, sewage input to water systems. This resulted in the loss of fisheries and marine habits disrupted and reduced tourism.
The Gulf of Mexico is essentially a large drain for the network of rivers known as the Mississippi-Atchafalaya River Basin (MARB), which includes major rivers such as the Mississippi and Missouri. MARB passes through 31 states, and agriculture is the dominant industry in several of those states, which is where the overflow of nutrients originates. The eutrophication process in the Gulf of Mexico is cyclical and grows in the summer and shrinks during the winter due to decreased agriculture only to return the following summer. This dead zone along the northern edge of the Gulf stretching along Texas and Louisiana measured 13,080 square kilometers in the summer of 2014, and it is the largest dead zone in the United States
Source: Gulf of Mexico Hypoxia https://gulfhypoxia.net/about-hypoxia/
Video - Dead Zone in the Gulf 2017
This following video gives a short summary of the 2017 Gulf of Mexico Hypoxic Zone. https://oceantoday.noaa.gov/happnowdeadzone/
The following image shows current areas around the globe that are hypoxic, eutrophic, or in recovery. This map shows dead zones (red) areas where excess nutrients might allow dead zones to develop (yellow). In some parts of the world, areas that had dead zones are getting better (green).
Source: Science News for Students (https://www.sciencenewsforstudents.org/article/suffocating-waters )
By Hill et al. (University of California, Davis), used under a CC-BY-NC-SA 4.0 international license. Download this book for free at https://geo.libretexts.org/Bookshelves/Oceanography/Book%3A_Oceanography_(Hill)
Phosphorus, Nitrogen, and Other Nutrient Pollution
The nutrients in fertilizer makes plants grow. Whereas using fertilizers may help crop yields (and profits) on land, their unintended release into waterway that lead to the ocean can have devastating impacts in the marine environment. Phosphorus and nitrogen compounds are essential nutrients for plant growth and is naturally occurring in upwelling ocean waters that support primary production. However, too much nitrogen and phosphorus from fertilizers used in agriculture and suburban lawn care can stimulate an overgrowth of phytoplankton resulting in a harmful algal bloom (HAB). When the phytoplankton sinks, dies, and decays, it can suck all the free oxygen out of the water, resulting in hypoxia (creating “dead zones” in regions that would otherwise be a marine environment teaming with life). Unwanted nutrients in runoff and groundwater seepage from agricultural and urban areas of the Midcontinent region of the United States is resulting in an ever-expanding dead zone in the coastal waters around the mouth of the Mississippi River in the Gulf of Mexico (Figure 1).

Figure 1. Map of the region near the mouth of the Mississippi River impacted by hypoxia caused by harmful algal blooms caused by nutrient pollution from farms and urban areas inland.
From Miracosta College, is shared under a not declared license and was authored, remixed, and/or curated by LibreTexts. Download this book for free at https://geo.libretexts.org/Bookshelves/Oceanography/Oceanography_101_(Miracosta)
We learned in section 3.3 that refraction causes waves to approach parallel to shore. However, most waves still reach the shore at a small angle, and as each one arrives, it pushes water along the shore, creating what is known as a longshore current within the surf zone (the areas where waves are breaking) (Figure 4.2.1). Longshore currents can move up to 4 km/hr, strong enough to carry people with them, as everyone knows who has been swimming in the ocean only to look up and see that they have been carried far down the beach from their towel!
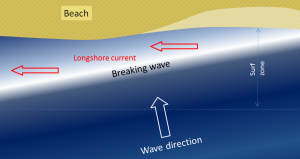
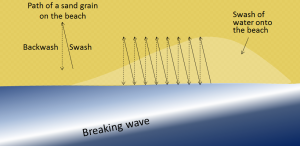
Another important effect of waves reaching the shore at an angle is that when they wash up onto the beach, they do so at an angle, but when that same wave water washes back down the beach, it moves straight down the slope of the beach (Figure 4.2.2). The upward-moving water, known as the swash, pushes sediment particles along the beach, while the downward-moving water, the backwash, brings them straight back. With every wave that washes up and then down the beach, particles of sediment are moved along the beach in a zigzag pattern.
The combined effects of sediment transport within the surf zone by the longshore current and sediment movement along the beach by swash and backwash is known as longshore transport, or littoral drift. Longshore transport moves a tremendous amount of sediment along coasts (both oceans and large lakes) around the world, and it is responsible for creating a variety of depositional features that we will discuss in section 4.4. The net movement of sediment due to longshore transport is to the south along both coasts of the continental United States, because the storms and high winds that originally create the swell tend to occur at higher latitudes and move to the south.
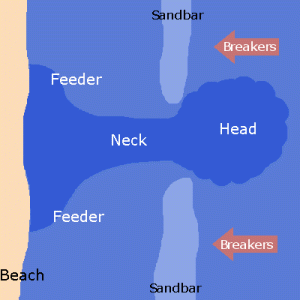
A rip current (often incorrectly called a "rip tide"; they are not really related to tides) is another type of current that develops in the nearshore area, and has the effect of returning water that has been pushed up to the shore by incoming waves or accumulated through longshore currents, particularly converging longshore currents. Rip currents often occur where there is a channel between sandbars that makes it easier for the retreating water to escape. As shown in Figure 4.2.3, rip currents flow straight out from the shore, and because the water is directed through a narrow space, the current can be very strong. The currents lose strength quickly just outside of the surf zone, but they can be dangerous to swimmers who get caught in them and are pulled away from shore. Swimmers caught in a rip current should not try to swim directly back to shore, as it is difficult to fight the current and the swimmer can quickly tire. Instead, swim parallel to the beach for a short distance until you are outside of the rip current, and then you can easily swim to shore.
Rip currents are visible in Figure 4.2.4, a beach at Tunquen in Chile near Valparaiso. As is evident from the photo, the rips correspond with embayments in the beach profile. Three of them are indicated with arrows, but it appears that there may be several others farther along the beach.

By Paul Webb, used under a CC-BY 4.0 international license. Download this book for free at https://rwu.pressbooks.pub/webboceanography/front-matter/preface/
Modified from "Physical Geology" by Steven Earle used under a CC-BY 4.0 international license. Download this book for free at http://open.bccampus.ca
In section 2.1 we learned that one of the reasons that Wegener's ideas of continental drift were initially rejected by the scientific community was that he could not provide a plausible mechanism for plate motion. However, with all that we have learned about the processes occurring in the Earth's interior since then, there is still some debate about the actual forces that make the plates move. One side in the argument holds that the plates are only moved by the traction caused by mantle convection. The other side holds that traction plays only a minor role and that two other forces, ridge push and slab pull, are more important. Some argue that the real answer lies somewhere in between.
To understand mantle convection, imagine a pot of water on a hot stove. The water at the bottom of the pot near the heat source becomes hot and expands, making it lighter (less dense) than the water above. The hot, low density water rises, and cooler, denser water sinks and flows in from the sides. This water then gets heated and rises, and the cycle continues. This creates a circular pattern of rising and sinking water called a convection cell. (To test this, try sprinkling a few flakes of spice in the center of a rapidly boiling pot of water. The flakes will move outwards to the edge of the pot as warmer water rises and pushes them aside).
Heat is continuously flowing outward from Earth’s interior, and the transfer of heat from the core to the mantle causes convection in the mantle (Figure 2.3.1). Even though the mantle material is essentially solid rock, it is sufficiently plastic (fluid) to slowly flow (at rates of centimeters per year) as long as a steady force is applied to it. This convection is a driving force for the movement of tectonic plates, as the horizontal movements of mantle under the crust drag the plates with them. At places where convection currents in the mantle are moving upward, new lithosphere forms and the plates move apart (diverge). Where two plates are converging (and the convective flow is downward), one plate will be subducted (pushed down) into the mantle beneath the other.
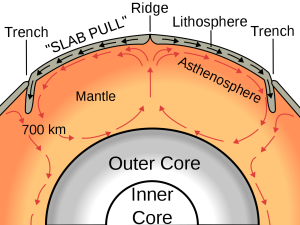
The ridge push/slab pull model also relies on mantle convection, but in this case it is not simply the traction from the convection cell that moves the plates. In this model, plates move through a combination of pull from the weight of the subducting edge of the plates, and through the outward pushing of an ocean ridge where magma is rising and forming new crust (Figure 2.3.2).

Additional links for more information:
- Animation speculating on the movements of the continents over the last 3 billion years.... https://www.youtube.com/watch?v=UwWWuttntio
- And what might happen over the next 300 million years: https://www.youtube.com/watch?v=bQywDr-btz4
Written by Dr. Cristina Cardona.
The balance of incoming and outgoing heat on Earth is referred to as its heat budget. As with any budget, to maintain constant conditions the budget must be balanced so that the incoming heat equals the outgoing heat. The heat budget of Earth appears below (Figure 6.1.1).
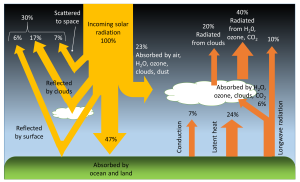
Of all of the solar energy reaching the Earth, about 30% is reflected back into space from the atmosphere, clouds, and surface of the Earth. Another 23% of the energy is absorbed by the water vapor, clouds, and dust in the atmosphere, where it is converted into heat. Just under half (47%) of the incoming solar radiation is absorbed by the land and ocean, and this energy heats up the Earth's surface. The energy absorbed by the Earth returns to the atmosphere through three processes; conduction, radiation, and latent heat (phase change)(Figure 6.1.1).
Conduction is the transfer of heat through direct contact between the surface and the atmosphere. Air is a relatively poor thermal conductor (which means it is a good insulator), so conduction represents only a small part of the energy transfer between the Earth and the atmosphere; equal to about 7% of the incoming solar energy.
All bodies with a temperature above absolute zero (-273o C) radiate heat in the form of longwave, infrared radiation (see the electromagnetic spectrum in section 5.9). The warmed Earth is no exception, and about 16% of the original solar energy is radiated from the Earth to the atmosphere (Figure 6.1.1). Some of this radiated energy will dissipate into space, but a significant amount of heat will be absorbed by the atmosphere. This is the basis for the greenhouse effect (Figure 6.1.2). In the greenhouse effect, shortwave solar radiation passes through the atmosphere and reaches the Earth's surface where it gets absorbed. When the radiation is re-emitted by the Earth, it is now in the form of long wavelength, infrared radiation, which does not easily pass through the atmosphere. Instead, this infrared radiation is absorbed by the atmosphere, particularly by the greenhouse gases such as CO2, methane, and water vapor. As a result, the atmosphere heats up. Without the greenhouse effect, the average temperature on Earth would be about -18o C, which is too cold for liquid water, and therefore life as we know it could not exist!
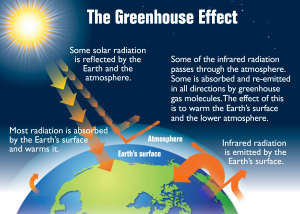
There is a great deal of concern about the greenhouse effect across the globe; not because of the presence of the effect itself, but because the effect is intensifying, causing climate change or global warming. Since the Industrial Revolution the atmospheric concentrations of the major greenhouse gases, particularly CO2 and methane, have increased dramatically due to industrialization, the burning of fossil fuels, and deforestation. At the same time, there has been rapid warming of the global climate; CO2 concentrations have increased more than 25% and global temperature has risen by 0.5o C over the past century. Unless production of these greenhouse gases is curbed, this rapid warming trend may continue, with potentially dire consequences. See section 6.5 for detailed information on the causes and effects of climate change.
The largest pathway for heat exchange between the land or oceans and the atmosphere is latent heat transferred through phase changes; heat released or absorbed when water moves between solid, liquid, and vapor forms (see section 5.1). Heat must be added to liquid water to make it evaporate, and when water vapor is formed, that heat is removed from the ocean and transferred to the atmosphere along with the water vapor. When water vapor condenses into rain, that heat is then returned to the oceans. The same process happens with the formation and melting of ice. Heat is absorbed by ice when it melts, and heat is released when ice forms, and these phase changes transfer heat between the oceans and the atmosphere.
To complete the heat budget, the heat that is absorbed by the atmosphere either directly from solar radiation or as a result of conduction, radiation and latent heat, is eventually radiated back into space (Figure 6.1.1).
Differential Heating of Earth's Surface
If the Earth was a flat surface facing the sun, every part of that surface would receive the same amount of incoming solar radiation. However, because the Earth is a sphere, sunlight is not equally distributed over the Earth's surface, so different regions of Earth will be heated to different degrees. This differential heating of Earth's surface occurs for a number of reasons. First, because of the curvature of Earth, sunlight only falls perpendicularly to the surface at the center of the sphere (equatorial regions). At any other point on Earth, the angle between the surface and the incoming solar radiation is less than 90o. Because of this, the same amount of incoming solar radiation will be concentrated in a smaller area at the equator, but will be spread over a much larger area at the poles (Figure 6.1.3). Thus the tropics receive more intense sunlight and a greater amount of heating per unit of area than the polar regions.

The angle at which sunlight strikes the Earth contributes to differential heating of the surface in an additional way. At the poles, because of the angle at which the solar energy strikes the surface, more of the light will glance off of the surface and the atmosphere and be reflected back into space. At the equator, the direct angle with which light reaches the surface results in more of the energy being absorbed rather than reflected. Finally, the poles reflect more solar energy than other parts of the Earth because the poles have a higher albedo. The albedo refers to reflectivity of a surface. Lighter surfaces are more reflective than darker surfaces (which absorb more energy), and therefore have a higher albedo. At the poles, the ice, snow and cloud cover create a much higher albedo, and the poles reflect more and absorb less solar energy than the lower latitudes. Through all of these mechanisms, the poles absorb much less solar radiation than equatorial regions, which is why the poles are cold and the tropics are very warm.
But there is an interesting twist to this global distribution of heat. The tropical regions actually receive more radiant heat than they emit, and the poles emit more heat than they receive (Figure 6.1.4). We should therefore expect that the tropics will be getting continually warmer, while the poles become increasingly cold. Yet this is not the case; so what is happening? Rather than the heat remaining isolated near the equator, about 20% of the heat from the tropics is transported to the poles before it is emitted. This large scale transport of energy moderates the climates at both extremes. The mechanisms for this heat transfer are ocean and atmospheric circulation, the topic of the next section.

The idea of differential heating of the Earth's surface is fundamental to understanding a wide range of oceanographic and atmospheric processes. This differential heating leads to atmospheric convection, which creates winds, which blow over the water and create waves and surface currents, and these currents influence nutrient distribution, which promotes primary production, which then supports the rest of the ocean ecosystem. So there's a lot riding on the simple fact that more light reaches the tropics than the poles!
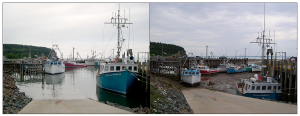
The Equilibrium Theory of tides predicts that each day there will be two high and two low tides, each one occurring at the same time day after day, with each pair producing tides of similar heights. While this view provides a basic explanation for the primary forces that generate the tides, it does not take into account such variables as the effects of the continents, the depth of the water, and many other factors. In all, there are almost 400 variables that must be incorporated into predicting the tides! The Dynamic Theory of tides takes these other factors into account, and shows that the tides are much more complicated and variable from place to place than the Equilibrium Theory would suggest. For example, some areas receive only one high and one low tide per day (see section 3.7). Furthermore, the tidal range varies greatly across the globe; in the Mediterranean Sea, there can be a difference of only 10 cm between high and low tides, while the Bay of Fundy in Canada experiences a tidal range of up to 17m (56 ft) every day (Figure 3.6.1).
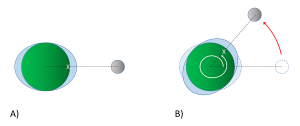
Examination of any tide chart will show that the tides don’t occur at same time each day; in fact, each tidal peak occurs about 50 minutes later than it did in the previous day. This is due to the orbit of the moon around the Earth. Imagine a high tide that occurs at a particular location (X) at 1:00 pm (Figure 3.6.2). The high tide occurs as location X moves through the bulge of water facing the moon. It will take the Earth 24 hours to complete one revolution, to bring location X back to site of the water bulge that caused that high tide. However, during those 24 hours, the moon has also moved as it orbits the Earth, so the high tide bulge has moved beyond its original location. The Earth thus has to rotate an additional distance for location X to reach the bulge and experience that same high tide. Because it takes the moon about 28 days to orbit the Earth, the moon gets "ahead" of the Earth's rotation by about 50 minutes per day. Therefore, it takes location X 24 hours and 50 minutes to rotate through the same tidal bulge, and as a result, the tidal peaks occur about 50 minutes later each day. In our example, an afternoon high tide at 1:00 pm on one day would be followed by a high tide at about 1:50 pm the following day. This 24 hour and 50 minute cycle is referred to as a tidal day.
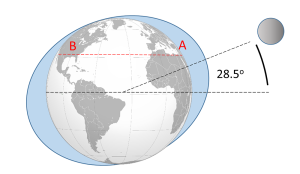
The motion of the moon impacts the tidal cycles in other ways. As the moon orbits the Earth, its orbital plane is at an angle relative to the rotational plane of Earth. This angle, or declination, means than the moon fluctuates between an angle of 28.5o north of the equator, to 28.5o south of the equator roughly every two weeks (the cycle from maximum to minimum and back takes about 27 days). Figure 3.6.3 illustrates a case where the moon is at its maximum declination 28.5o north of the equator, creating its corresponding tidal maxima. A point on the Earth at the latitude indicated by the red line would experience two high tides as it rotated through 24 hours, at points A and B. But the two high tides would not be of equal heights; the high tide at A would be higher than the high tide at B. This helps create a mixed semi-diurnal tide; two high tides of different heights per day (see section 3.7).
Finally, the continents and the bottom topography of the oceans have an impact on the tides that are experienced in an area. Because the tides are essentially waves with extremely long wavelengths extending halfway across the Earth, they behave as shallow water waves, and they are influenced and refracted by the bottom contours, leading to regional tidal variations. When the tidal crests encounter land, they are are reflected, and the wave moves back out to sea, theoretically until it encounters another continent on the opposite side of the ocean basin. The crest is once again reflected, and the water oscillates back and forth as a standing wave across the ocean basin. However, because of the scale over which these tidal waves move, we must take into account the influence of the Coriolis Effect. As the tidal crest is reflected back across the ocean basin, its path is deflected by the Coriolis force; to the right in the Northern Hemisphere, and to the left in the Southern Hemisphere. Using the Northern Hemisphere as an example, imagine a tidal crest that has reached land on the western side of an ocean basin. It would have a tendency to be reflected and move across the basin towards the east. But the Coriolis force deflects the movement to the right, causing the crest to instead head south. When the crest hits land in the south, it would now tend to reflect towards the north, but once again the Coriolis deflection to the right kicks in, and the wave instead moves to the east. From the east the reflected wave is deflected to the north, and so on. The result of all of this is that instead of a simple standing wave moving back and forth across the ocean, the tidal crest follows a circular pattern around the ocean basin, counterclockwise in the Northern Hemisphere and clockwise in the Southern Hemisphere. This is analogous to shaking a pan full of water in a circular manner, and watching the water follow a similar circular path as it sloshes around inside. This large scale circular rotation pattern of tides is called amphidromic circulation (Figure 3.6.4). The rotation occurs around a central amphidromic point or node, that shows little tidal variation, while the largest tidal ranges occur on the edges of the circulation pattern. In Figure 3.6.4 the amphidromic points are indicated by the dark blue areas where the white lines converge, like spokes from a bicycle wheel, and the dark red and brown areas show the regions of maximum tidal heights. The tidal maxima will rotate around the amphidromic points, taking about 12 hours for a complete rotation, leading to two high and two low tides per day in many places. If a tidal maximum is occurring along one of the white lines in Figure 3.6.4 at a certain time in the Northern Hemisphere, one hour later that high tide will have moved to the white line to the left (counterclockwise), and so on until it completes a rotation. In the Southern Hemisphere, the tide will move to the line to the right for clockwise rotation.

The result of all of these variables is that the tides will not always occur twice each day, at the same time and with equal heights as the Equilibrium Theory of tides may suggest. Instead, each region of the oceans has a unique set of factors that contribute to the types of tides it will experience. The major types of tides are discussed in the next section.
By Paul Webb, used under a CC-BY 4.0 international license. Download this book for free at https://rwu.pressbooks.pub/webboceanography/front-matter/preface/
Some coastal areas are dominated by erosion, an example being the Pacific coast of North America, while others are dominated by deposition, examples being the Atlantic and Caribbean coasts of the United States. But on almost all coasts, both deposition and erosion are happening to varying degrees most of the time, although in different places. On deposition-dominant coasts, the coastal sediments are still being eroded from some areas and deposited in others.
On coasts that are dominated by depositional processes, most of the sediment being deposited typically comes from large rivers. Much of the sediment is immediately deposited at the mouth of the river, creating large fan-shaped deltas. An obvious example is where the Mississippi River flows into the Gulf of Mexico at New Orleans; another is the Yellow (Huang He) River in China (Figure 4.4.1).

Figure 4.4.1 The Yellow River delta in China, created by one of the most sediment-laden rivers on Earth (NASA [Public domain], via Wikimedia Commons).


Tombolos are common where islands are abundant, and they typically form where there is a wave shadow behind a nearshore island (Figure 4.4.4). This becomes an area with reduced energy, and so the longshore current slows and sediments accumulate. Eventually enough sediments accumulate to connect the island to the mainland with a tombolo (Figure 4.4.5).


In areas where coastal sediments are abundant and coastal relief is low (because there has been little or no recent coastal uplift), it is common for barrier islands to form (Figure 4.4.6). Barrier islands are elongated islands composed of sand that form offshore from the mainland, potentially reaching several kilometers wide and hundreds of kilometers long. They are common along the U.S. Gulf Coast from Texas to Florida, and along the U.S. Atlantic Coast from Florida to Massachusetts. The islands often form as the result of sediment moving offshore through river discharge, while wave action works to push the sediment back towards the shore. The resulting sediment buildup is then stretched into long barrier islands by longshore transport.

Mature barrier islands contain a number of ecological zones. Beginning on the ocean side of the island there is a beach, consisting of the zones we discussed in section 4.1. Behind the beach lie dunes that are built up by sand transported by wind. The ocean side of the dunes are home to grasses and other plants which help stabilize the sand from erosion, and also help slow down the wind to allow sand to settle and accumulate. Beyond the dunes lies a more heavily vegetated barrier flat, covered by larger shrubs and trees that are tolerant to the high winds and salty conditions. As the land slopes down on the side of the island facing the mainland, the low-lying areas transition into a salt marsh or mud flat habitat, which is protected from wave action, but is influenced by tidal changes. The mud flats are colonized by grasses, which slow down the movement of water and lead to increased sediment deposition, building up the land in the marsh. Different species of grasses eventually dominate the different elevations of the salt marsh, depending on their tolerance for submersion in seawater. These salt marshes are very important habitats for many invertebrates, birds, and juvenile fish. Between the island and the mainland lies a lagoon, which usually contains brackish water from the mixing of fresh water runoff from the land and the seawater within a somewhat enclosed space. Barrier islands, although attractive locations for beach houses, are not permanent structures, and people should be wary of building on them. Over time, the erosion on the seaward side of the island, and the expansion of the marsh on the landward side, causes the island to slowly move towards the mainland, eventually closing off the lagoon. Maintaining dune grasses is one way to slow this movement, and as we will see in the next section, people have developed a number of other strategies to try to curtail the natural erosion of beaches.
By Paul Webb, used under a CC-BY 4.0 international license. Download this book for free at https://rwu.pressbooks.pub/webboceanography/front-matter/preface/
Modified from "Physical Geology" by Steven Earle used under a CC-BY 4.0 international license. Download this book for free at http://open.bccampus.ca
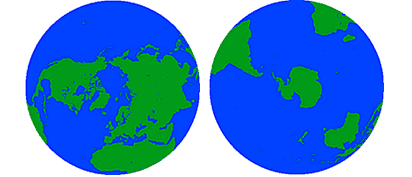
Let's begin by looking at a few basic facts about the oceans. We often think of Earth in terms of its land area, but in reality 71% of the Earth's surface is covered by oceans, while only 29% is land. Oceans cover an area of 139 million miles2 or 361 million km2, and contain a volume of about 1.37 billion km3 of water. All of this water is not distributed equally over the Earth; 61% of the Northern Hemisphere is covered by oceans, while in the Southern Hemisphere the oceans cover 81% of the surface area (Figure 1.1.1).
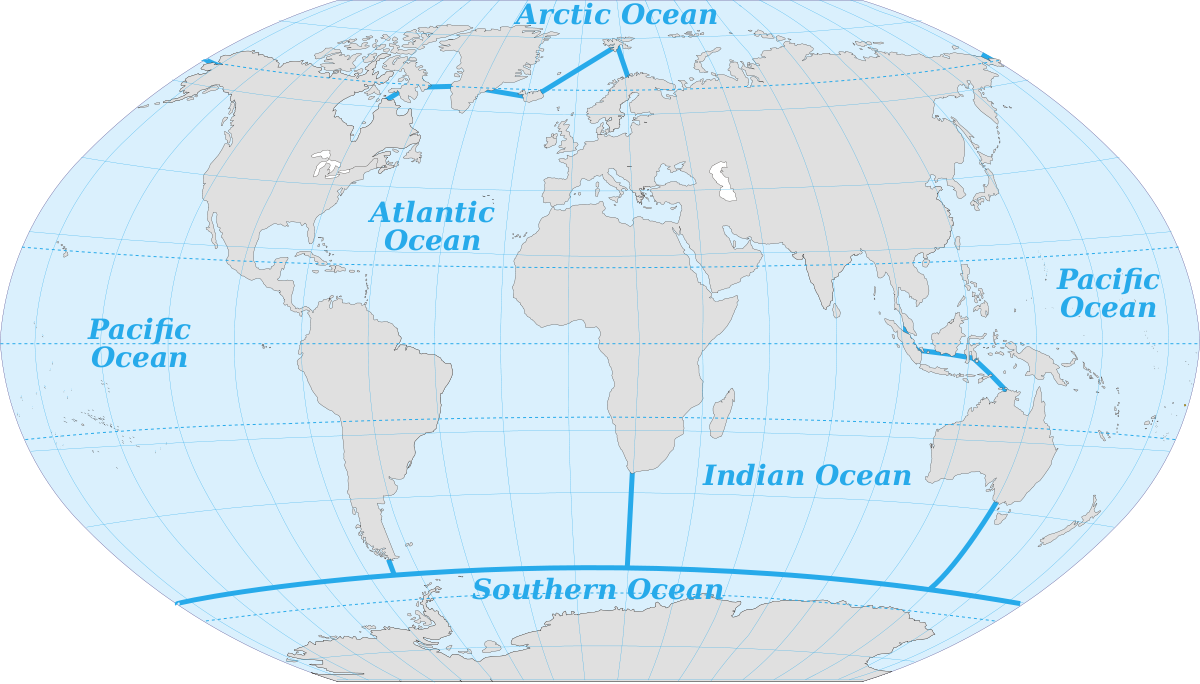
Various sources differ in the number of recognized ocean basins. Historically the major oceans were recognized as the Pacific, Atlantic, Indian, and Arctic Oceans. More recently, the Southern Ocean has been recognized as fifth named ocean, comprising all of the water from the coast of Antarctica to 60o S (Figure 1.1.2). In 2000 these boundaries were submitted to the International Hydrographic Organization for official recognition, but several countries do not recognize it as a separate ocean, but rather as the southern extension of the other major oceans. The Southern Ocean has its own unique characteristics, so for the purposes of this book we will include it as a separate ocean.
The oceans account for vast amounts of water, containing 97% of the water on Earth's surface, with over half of the water in the Pacific alone (Table 1.1.1).
Table 1.1.1 Percentage of Earth's water in various locations
| Atlantic | 25% |
|---|---|
| Indian | 20% |
| Ice | 2% |
| Ground water | 0.6% |
| Atmosphere, lakes & rivers | 0.01% |
The average depth of the world ocean is about 3800m (12,500 ft), which is about four times deeper than the average land elevation is high (840m or 2800 ft). In fact Mt. Everest, the highest point on land, is 8848m (29,028 ft) high, while the deepest part of the ocean, the Challenger Deep of the Marianas Trench is approximately 10,920m (36,200 ft) deep. So you could submerge Mt. Everest in the Marianas Trench and it would still be covered by over 2 km of water! Because there is so much more water on Earth than there is land, if you could smooth out the land elevation the entire Earth would still be covered by water about 2700 m deep.
Of the major ocean basins, the Pacific is the largest (almost as large as all of the others combined), and is the deepest (Table 1.1.2).
Table 1.1.2 Area and depth of the major oceans
Watch the video below for some perspective on the size and depth of the oceans.
https://www.youtube.com/watch?v=UwVNkfCov1k
By Paul Webb, used under a CC-BY 4.0 international license. Download this book for free at https://rwu.pressbooks.pub/webboceanography/front-matter/preface/


