29 4.5 Human Interference with Shorelines
The continued erosion and deposition of coastal sediments is a natural process, with features forming and disappearing as sea level and other conditions change. However, we have also come to enjoy and rely on many of these beaches and other coastal features for commerce, recreation, and living space. So from our perspective, we often see the transient nature of the coast as a threat to our activities, and as a result we have developed a number of ways to try and influence the erosion process, usually through hard stabilization, or the building of structures to stop the flow of sand. While some of these efforts have been successful, many others have actually exacerbated the problem, as we will see below.
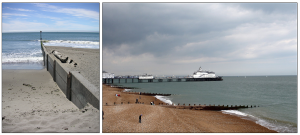
Groins (or groynes) are barriers built perpendicular to the shore (Figure 4.5.1 left). Groins are built to interrupt longshore transport and trap sand upstream of the groin, which they do very well. But downstream of the groin the source of replacement sand is cut off, while sand continues to be removed, so erosion can become even more pronounced on that side of the groin. To prevent that erosion, another groin must be built downstream of the first one, which then creates its own erosion problems, leading to another groin, and so on. Eventually a beach may become covered in a series of groins, called a groin field, all trying to stabilize the natural flow of sand (Figure 4.5.1 right).
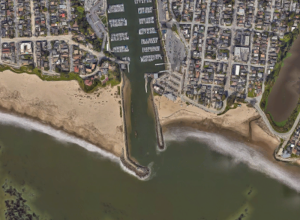
Jetties are like longer groins, often built to protect the mouths of harbors to prevent them from filling with sand. Because they are longer they can trap more sand than groins, and they also can contribute to increased erosion on the downstream side (Figure 4.5.2). If too much sand accumulates upstream of the jetty it can spread past the jetty and into the mouth of the harbor, in which case the jetty may need to be extended.
Breakwaters are walls that are usually built parallel to the shore. Their purpose is not necessarily to interfere with sediment transport, but instead to protect the areas behind them from heavy wave action, so they are often deployed at the mouth of a harbor, or to protect the boats in a mooring field. But breakwaters do have an unintended impact on sediment distribution. Longshore transport continues to move sand along the beach, but once it gets behind the breakwater the lack of wave action interrupts the flow, and the sand settles and accumulates. The beach grows behind a breakwater, until eventually they may become connected (Figure 4.5.3). With the longshore transport interrupted, increased erosion can occur downstream of the breakwater.

Santa Monica Pier
The beach around the Santa Monica Pier in California provides a good example of the effects of breakwaters on a sandy shore. A breakwater was constructed in the early 1930s to protect the pier and the boats that moored near it. Following the construction, the once-straight beach became much wider behind the breakwater as sand accumulated in the absence of strong wave action (below left). Now that the breakwater is no longer in place, the bulge in the shoreline is gone, and the beach is much straighter once again (below right).
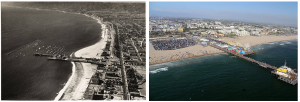
Left; aerial image of Santa Monica Pier and breakwater from 1936 (Courtesy of Santa Monica Public Library Image Archives/ Spence Air Photos). Right; Santa Monica Pier in 2011 (© JCS, CC BY-SA 3.0, via Wikimedia Commons).
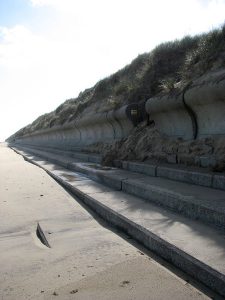
Seawalls are constructed at the top of the surf zone, where the waves crash against the shore. The walls are designed as a barrier between the waves and the shore, to prevent the land from being eroded (Figure 4.5.4). They are often utilized in beachfront property to prevent the ground under a home from being undermined by the waves. However, as with the other forms of hard stabilization we have discussed, seawalls are not without their own environmental consequences. The sudden release of wave energy on a seawall can create turbulence, which undermines the sediment at the base of the wall and causes it to erode. Furthermore, on a softer, natural coastline some of the wave energy is absorbed or dissipated, but with a hard seawall most of the wave energy is reflected, leading to stronger longshore currents and faster erosion. In many places where seawalls have been built the beaches are getting steeper, and erosion rates have increased, with the potential for seawalls to collapse along with whatever they are supporting. Because of this, some coastal communities are phasing out seawall construction to try to return to more natural beach fronts.
By Paul Webb, used under a CC-BY 4.0 international license. Download this book for free at https://rwu.pressbooks.pub/webboceanography/front-matter/preface/
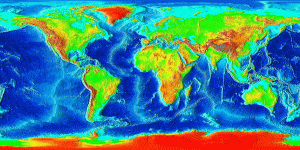
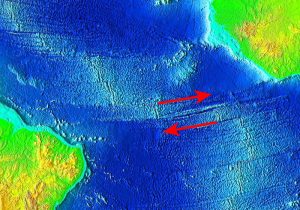
Divergent boundaries are spreading boundaries, where new oceanic crust is created to fill in the space as the plates move apart. Most divergent boundaries are located along mid-ocean oceanic ridges (although some are on land). The mid-ocean ridge system is a giant undersea mountain range, and is the largest geological feature on Earth; at 65,000 km long and about 1000 km wide, it covers 23% of Earth’s surface (Figure 2.5.1). Because the new crust formed at the plate boundary is warmer than the surrounding crust, it has a lower density so it sits higher on the mantle, creating the mountain chain. Running down the middle of the mid-ocean ridge is a rift valley 25-50 km wide and 1 km deep. Although oceanic spreading ridges appear to be curved features on Earth’s surface, in fact the ridges are composed of a series of straight-line segments, offset at intervals by faults perpendicular to the ridge, called transform faults. These transform faults make the mid-ocean ridge system look like a giant zipper on the seafloor (Figure 2.5.2). As we will see in section 3.7, movements along transform faults between two adjacent ridge segments are responsible for many earthquakes.
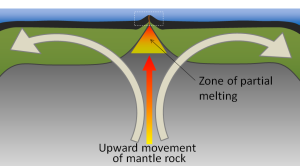
The crustal material created at a spreading boundary is always oceanic in character; in other words, it is igneous rock (e.g., basalt or gabbro, rich in ferromagnesian minerals), forming from magma derived from partial melting of the mantle caused by decompression as hot mantle rock from depth is moved toward the surface (Figure 2.5.3). The triangular zone of partial melting near the ridge crest is approximately 60 km thick and the proportion of magma is about 10% of the rock volume, thus producing crust that is about 6 km thick. This magma oozes out onto the seafloor to form pillow basalts, breccias (fragmented basaltic rock), and flows, interbedded in some cases with limestone or chert. Over time, the igneous rock of the oceanic crust gets covered with layers of sediment, which eventually become sedimentary rock.
Spreading is hypothesized to start within a continental area with up-warping or doming of crust related to an underlying mantle plume or series of mantle plumes. The buoyancy of the mantle plume material creates a dome within the crust, causing it to fracture. When a series of mantle plumes exists beneath a large continent, the resulting rifts may align and lead to the formation of a rift valley (such as the present-day Great Rift Valley in eastern Africa). It is suggested that this type of valley eventually develops into a linear sea (such as the present-day Red Sea), and finally into an ocean (such as the Atlantic). It is likely that as many as 20 mantle plumes, many of which still exist, were responsible for the initiation of the rifting of Pangaea along what is now the mid-Atlantic ridge.
There are multiple lines of evidence demonstrating that new oceanic crust is forming at these seafloor spreading centers:
1. Age of the crust:
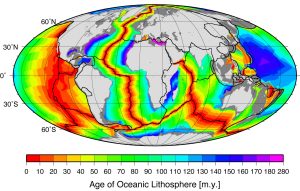
Comparing the ages of the oceanic crust near a mid-ocean ridge shows that the crust is youngest right at the spreading center, and gets progressively older as you move away from the divergent boundary in either direction, aging approximately 1 million years for every 20-40 km from the ridge. Furthermore, the pattern of crust age is fairly symmetrical on either side of the ridge (Figure 2.5.4).
The oldest oceanic crust is around 280 Ma in the eastern Mediterranean, and the oldest parts of the open ocean are around 180 Ma on either side of the north Atlantic. It may be surprising, considering that parts of the continental crust are close to 4,000 Ma old, that the oldest seafloor is less than 300 Ma. Of course, the reason for this is that all seafloor older than that has been either subducted (see section 3.6) or pushed up to become part of the continental crust. As one would expect, the oceanic crust is very young near the spreading ridges (Figure 2.5.4), and there are obvious differences in the rate of sea-floor spreading along different ridges. The ridges in the Pacific and southeastern Indian Oceans have wide age bands, indicating rapid spreading (approaching 10 cm/year on each side in some areas), while those in the Atlantic and western Indian Oceans are spreading much more slowly (less than 2 cm/year on each side in some areas).
2. Sediment thickness:
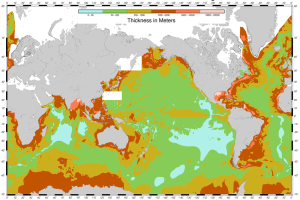
With the development of seismic reflection sounding (similar to echo sounding described in section 1.4) it became possible to see through the seafloor sediments and map the bedrock topography and crustal thickness. Hence sediment thicknesses could be mapped, and it was soon discovered that although the sediments were up to several thousands of meters thick near the continents, they were relatively thin — or even non-existent — in the ocean ridge areas (Figure 2.5.5). This makes sense when combined with the data on the age of the oceanic crust; the farther from the spreading center the older the crust, the longer it has had to accumulate sediment, and the thicker the sediment layer. Additionally, the bottom layers of sediment are older the farther you get from the ridge, indicating that they were deposited on the crust long ago when the crust was first formed at the ridge.
3. Heat flow:
Measurements of rates of heat flow through the ocean floor revealed that the rates are higher than average (about 8x higher) along the ridges, and lower than average in the trench areas (about 1/20th of the average). The areas of high heat flow are correlated with upward convection of hot mantle material as new crust is formed, and the areas of low heat flow are correlated with downward convection at subduction zones.
4. Magnetic reversals:
In section 2.2 we saw that rocks could retain magnetic information that they acquired when they were formed. However, Earth's magnetic field is not stable over geological time. For reasons that are not completely understood, the magnetic field decays periodically and then becomes re-established. When it does re-establish, it may be oriented the way it was before the decay, or it may be oriented with the reversed polarity. During periods of reversed polarity, a compass would point south instead of north. Over the past 250 Ma, there have a few hundred magnetic field reversals, and their timing has been anything but regular. The shortest ones that geologists have been able to define lasted only a few thousand years, and the longest one was more than 30 million years, during the Cretaceous (Figure 2.5.6). The present “normal” event has persisted for about 780,000 years.

Beginning in the 1950s, scientists started using magnetometer readings when studying ocean floor topography. The first comprehensive magnetic data set was compiled in 1958 for an area off the coast of British Columbia and Washington State. This survey revealed a mysterious pattern of alternating stripes of low and high magnetic intensity in sea-floor rocks (Figure 2.5.7). Subsequent studies elsewhere in the ocean also observed these magnetic anomalies, and most importantly, the fact that the magnetic patterns are symmetrical with respect to ocean ridges.
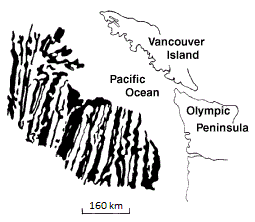
In the 1960s, in what would become known as the Vine-Matthews-Morley (VMM) hypothesis, it was proposed that the patterns associated with ridges were related to the magnetic reversals, and that oceanic crust created from cooling basalt during a normal event would have polarity aligned with the present magnetic field, and thus would produce a positive anomaly (a black stripe on the sea-floor magnetic map), whereas oceanic crust created during a reversed event would have polarity opposite to the present field and thus would produce a negative magnetic anomaly (a white stripe). The widths of the anomalies varied according to the spreading rates characteristic of the different ridges. This process is illustrated in Figure 2.5.8. New crust is formed (panel a) and takes on the existing normal magnetic polarity. Over time, as the plates continue to diverge, the magnetic polarity reverses, and new crust formed at the ridge now takes on the reversed polarity (white stripes in Figure 2.5.8). In panel b, the poles have reverted to normal, so once again the new crust shows normal polarity before moving away from the ridge. Eventually, this creates a series of parallel, alternating bands of reversals, symmetrical around the spreading center (panel c).

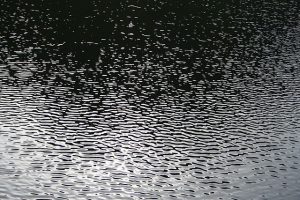
Most ocean waves are generated by wind. Wind blowing across the water's surface creates little disturbances called capillary waves, or ripples that start from gentle breezes (Figure 3.2.1). Capillary waves have a rounded crest with a V-shaped trough, and wavelengths less than 1.7 cm. These small ripples give the wind something to "grip" onto to generate larger waves when the wind energy increases, and once the wavelength exceeds 1.7 cm the wave transitions from a capillary wave to a wind wave. As waves are produced, they are opposed by a restoring force that attempts to return the water to its calm, equilibrium condition. The restoring force of the small capillary waves is surface tension, but for larger wind-generated waves gravity becomes the restoring force.
As the energy of the wind increases, so does the size, length and speed of the resulting waves. There are three important factors determining how much energy is transferred from wind to waves, and thus how large the waves will get:
- Wind speed.
- The duration of the wind, or how long the wind blows continuously over the water.
- The distance over which the wind blows across the water in the same direction, also known as the fetch.
Increasing any of these factors increases the energy of wind waves, and therefore their size and speed. But there is an upper limit to how large wind-generated waves can get. As wind energy increases, the waves receive more energy and they get both larger and steeper (recall from section 3.1 that wave steepness = height/wavelength). When the wave height exceeds 1/7 of the wavelength, the wave becomes unstable and collapses, forming whitecaps.
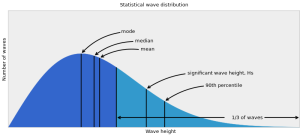
The ocean surface represents an irregular mixture of hundreds of waves of different speeds and sizes, all coming from different directions and interacting with each other. A histogram of wave heights within this mixture reveals a bell-shaped curve (Figure 3.2.2). In addition to basic statistics such as mode (most probable), median and mean wave height, wave heights are also reported in other ways. Marine weather forecasts and ship and buoy data often report significant wave height (Hs), which is the mean height of the largest one-third of the waves. Mean wave height is approximately equal to two-thirds of the significant wave height. Finally, there is the minimum height of the highest 10% of waves (the 90th percentile of wave heights), often expressed as H1/10.
Under strong wind conditions, the ocean surface becomes a chaotic mixture of choppy, whitecapped wind-generated waves. The term sea state describes the size and extent of the wind-generated waves in a particular area. When the waves are at their maximum size for the existing wind speed, duration, and fetch, it is referred to as a fully developed sea. The sea state is often reported on the Beaufort scale, ranging from 0-12, where 0 means calm, windless and waveless conditions, while Beaufort 12 is a hurricane (see box below).
The Beaufort Scale
The Beaufort scale is used to describe the wind and sea state conditions on the ocean. It is an observational scale based on the judgement of the observer, rather than one dictated by accurate measurements of wave height. Beaufort 0 represents calm, flat conditions, while Beaufort 12 represents a hurricane.


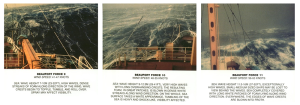
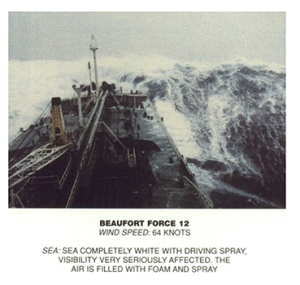
(Images by United States National Weather Service (http://www.crh.noaa.gov/mkx/marinefcst.php) [Public domain], via Wikimedia Commons).
A fully developed sea often occurs under stormy conditions, where high winds create a chaotic, random pattern of waves and whitecaps of varying sizes. The waves will propagate outwards from the center of the storm, powered by the strong winds. However, as the storm subsides and the winds weaken, these irregular seas will sort themselves out into more ordered patterns. Recall that open ocean waves will usually be deep water waves, and their speed will depend on their wavelength (section 3.1). As the waves move away from the storm center, they sort themselves out based on speed, with longer wavelength waves traveling faster than shorter wavelength waves. This means that eventually all of the waves in a particular area will be traveling with the same wavelength, creating regular, long period waves called swell (Figure 3.2.3). We experience swell as the slow up and down or rocking motion we feel on a boat, or with the regular arrival of waves on shore. Swell can travel very long distances without losing much energy, so we can observe large swells arriving at the shore even where there is no local wind; the waves were produced by a storm far offshore, and were sorted into swell as they traveled towards the coast.
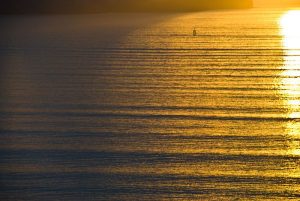
Because swell travels such long distances, eventually swells coming from different directions will run into each other, and when they do they create interference patterns. The interference pattern is created by adding the features of the waves together, and the type of interference that is created depends on how the waves interact with each other (Figure 3.2.4). Constructive interference occurs when the two waves are completely in phase; the crest of one wave lines up exactly with the crest of the other wave, as do the troughs of the two waves. Adding the two crest together creates a crest that is higher than in either of the source waves, and adding the troughs creates a deeper trough than in the original waves. The result of constructive interference is therefore to create waves that are larger than the original source waves. In destructive interference, the waves interact completely out of phase, where the crest of one wave aligns with the trough of the other wave. In this case, the crest and the trough work to cancel each other out, creating a wave that is smaller than either of the source waves. In reality, it is rare to find perfect constructive or destructive interference as displayed in Figure 3.2.4. Most interference by swells at sea is mixed interference, which contains a mix of both constructive and destructive interference. The interacting swells do not have the same wavelength, so some points show constructive interference, and some points show destructive interference, to varying degrees. This results in an irregular pattern of both small and large waves, called surf beat.
It is important to point out that these interference patterns are only temporary disturbances, and do not affect the properties of the source waves. Moving swells interact and create interference where they meet, but each wave continues on unaffected after the swells pass each other.

About half of the waves in the open sea are less than 2 m high, and only 10-15% exceed 6 m. But the ocean can produce some extremely large waves. The largest wind wave reliably measured at sea occurred in the Pacific Ocean in 1935, and was measured by the navy tanker the USS Ramapo. Its crew measured a wave of 34 m or about 112 ft high! Occasionally constructive interference will produce waves that are exceptionally large, even when all of the surrounding waves are of normal height. These random, large waves are called rogue waves (Figure 3.2.5). A rogue wave is usually defined as a wave that is at least twice the size of the significant wave height, which is the average height of the highest one-third of waves in the region. It is not uncommon for rogue waves to reach heights of 20 m or more.

Figure 3.2.5 A rogue wave in the Bay of Biscay, off of the French coast, ca. 1940 (NOAA, [Public domain], via Wikimedia Commons).
Rogue waves are particularly common off of the southeast coast of South Africa, a region referred to as the "wild coast." Here, Antarctic storm waves move north into the oncoming Agulhas Current, and the wave energy gets focused over a narrow area, leading to constructive interference. This area may be responsible for sinking more ships than anywhere else on Earth. On average about 100 ships are lost every year across the globe, and many of these losses are probably due to rogue waves.
Waves in the Southern Ocean are generally fairly large (the red areas in Figure 3.2.6) because of the strong winds and the lack of landmasses, which provide the winds with a very long fetch, allowing them to blow unimpeded over the ocean for very long distances. These latitudes have been termed the “Roaring Forties”, “Furious Fifties”, and “Screaming Sixties” due to the high winds.

Estuaries are partially enclosed bodies of water where the salt water is diluted by fresh water input from land, creating brackish water with a salinity somewhere between fresh water and normal seawater. Estuaries include many bays, inlets, and sounds, and are often subject to large temperature and salinity variations due to their enclosed nature and smaller size compared to the open ocean.
Estuaries can be classified geologically into four basic categories based on their method of origin. In all cases they are a result of rising sea level over the last 18,000 years, beginning with the end of the last ice age; a period that has seen a rise of about 130 m. The rise in sea level has flooded coastal areas that were previously above water, and prevented the estuaries from being filled in by all of the sediments that have been emptied into them.
The first type is a coastal plain estuary, or drowned river valley. These estuaries are formed as sea level rises and floods an existing river valley, mixing salt and fresh water to create the brackish conditions where the river meets the sea. These types of estuaries are common along the east coast of the United States, including major bodies such as the Chesapeake Bay, Delaware Bay, and Narragansett Bay (Figure 4.6.1). Coastal plain estuaries are usually shallow, and since there is a lot of sediment input from the rivers, there are often a number of depositional features associated with them such as spits and barrier islands.
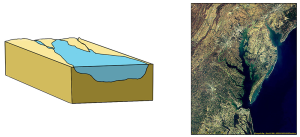
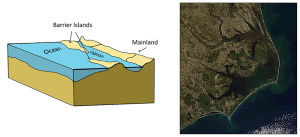
The presence of sand bars, spits, and barrier islands can lead to bar-built estuaries, where a barrier is created between the mainland and the ocean. The water that remains inside the sand bar is cut off from complete mixing with the ocean, and receives freshwater input from the mainland, creating estuarine conditions (Figure 4.6.2).
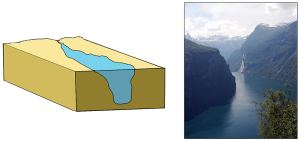
Fjords are estuaries formed in deep, U-shaped basins that were carved out by advancing glaciers. When the glaciers melted and retreated, sea level rose and filled these troughs, creating deep, steep-walled fjords (Figure 4.6.3). Fjords are common in Norway, Alaska, Canada, and New Zealand, where there are mountainous coastlines once covered by glaciers.
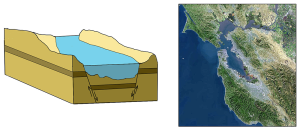
Tectonic estuaries are the result of tectonic movements, where faulting causes some sections of the crust to subside, and those lower elevation sections then get flooded with seawater. San Francisco Bay is an example of a tectonic estuary (Figure 4.6.4).
Estuaries are also classified based on their salinity and mixing patterns. The amount of mixing of fresh and salt water in an estuary depends on the rate at which fresh water enters the head of the estuary from river input, and the amount of seawater that enters the estuary mouth as a result of tidal movements. The input of fresh water is reflected in the flushing time of the estuary. This refers to the time it would take for the in-flowing fresh water to completely replace all the fresh water currently in the estuary. Seawater input is measured by the tidal volume, or tidal prism, which is the average volume of sea water entering and leaving the estuary during each tidal cycle. In other words, it is the volume difference between high and low tides. The interaction between the flushing time, tidal volume, and the shape of the estuary will determine the extent and type of water mixing within the estuary.
In a vertically mixed, or well-mixed estuary there is complete mixing of fresh and salt water from the surface to the bottom. In a particular location the salinity is constant at all depths, but across the estuary the salinity is lowest at the head where the fresh water enters, and is highest at the mouth, where the seawater comes in. This type of salinity profile usually occurs in shallower estuaries, where the shallow depths allow complete mixing from the surface to the bottom.
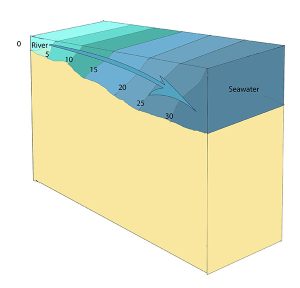
Slightly stratified or partially mixed estuaries have similar salinity profiles to vertically mixed estuaries, where salinity increases from the head to the mouth, but there is also a slight increase in salinity with depth at any point. This usually occurs in deeper estuaries than those that are well-mixed, where waves and currents mix the surface water, but the mixing may not extend all the way to the bottom.

A salt wedge estuary occurs where the outflow of fresh water is strong enough to prevent the denser ocean water to enter through the surface, and where the estuary is deep enough that surface waves and turbulence have little mixing effect on the deeper water. Fresh water flows out along surface, salt water flows in at depth, creating a wedge shaped lens of seawater moving along the bottom. The surface water may remain mostly fresh throughout the estuary if there is no mixing, or it can become brackish depending on the level of mixing that occurs.

Highly stratified profiles are found in very deep estuaries, such as in fjords. Because of the depth, mixing of fresh and salt water only occurs near the surface, so in the upper layers salinity increases from the head to the mouth, but the deeper water is of standard ocean salinity.

Estuaries are very important commercially, as they are home to the majority of the world’s metropolitan areas, they serve as ports for industrial activity, and a large percentage of the world's population lives near estuaries. Estuaries are also very important biologically, especially in their role as the breeding grounds for many species of fish, birds, and invertebrates.
By Paul Webb, used under a CC-BY 4.0 international license. Download this book for free at https://rwu.pressbooks.pub/webboceanography/front-matter/preface/
Estuaries are partially enclosed bodies of water where the salt water is diluted by fresh water input from land, creating brackish water with a salinity somewhere between fresh water and normal seawater. Estuaries include many bays, inlets, and sounds, and are often subject to large temperature and salinity variations due to their enclosed nature and smaller size compared to the open ocean.
Estuaries can be classified geologically into four basic categories based on their method of origin. In all cases they are a result of rising sea level over the last 18,000 years, beginning with the end of the last ice age; a period that has seen a rise of about 130 m. The rise in sea level has flooded coastal areas that were previously above water, and prevented the estuaries from being filled in by all of the sediments that have been emptied into them.
The first type is a coastal plain estuary, or drowned river valley. These estuaries are formed as sea level rises and floods an existing river valley, mixing salt and fresh water to create the brackish conditions where the river meets the sea. These types of estuaries are common along the east coast of the United States, including major bodies such as the Chesapeake Bay, Delaware Bay, and Narragansett Bay (Figure 4.6.1). Coastal plain estuaries are usually shallow, and since there is a lot of sediment input from the rivers, there are often a number of depositional features associated with them such as spits and barrier islands.

The presence of sand bars, spits, and barrier islands can lead to bar-built estuaries, where a barrier is created between the mainland and the ocean. The water that remains inside the sand bar is cut off from complete mixing with the ocean, and receives freshwater input from the mainland, creating estuarine conditions (Figure 4.6.2).

Fjords are estuaries formed in deep, U-shaped basins that were carved out by advancing glaciers. When the glaciers melted and retreated, sea level rose and filled these troughs, creating deep, steep-walled fjords (Figure 4.6.3). Fjords are common in Norway, Alaska, Canada, and New Zealand, where there are mountainous coastlines once covered by glaciers.

Tectonic estuaries are the result of tectonic movements, where faulting causes some sections of the crust to subside, and those lower elevation sections then get flooded with seawater. San Francisco Bay is an example of a tectonic estuary (Figure 4.6.4).

Estuaries are also classified based on their salinity and mixing patterns. The amount of mixing of fresh and salt water in an estuary depends on the rate at which fresh water enters the head of the estuary from river input, and the amount of seawater that enters the estuary mouth as a result of tidal movements. The input of fresh water is reflected in the flushing time of the estuary. This refers to the time it would take for the in-flowing fresh water to completely replace all the fresh water currently in the estuary. Seawater input is measured by the tidal volume, or tidal prism, which is the average volume of sea water entering and leaving the estuary during each tidal cycle. In other words, it is the volume difference between high and low tides. The interaction between the flushing time, tidal volume, and the shape of the estuary will determine the extent and type of water mixing within the estuary.
In a vertically mixed, or well-mixed estuary there is complete mixing of fresh and salt water from the surface to the bottom. In a particular location the salinity is constant at all depths, but across the estuary the salinity is lowest at the head where the fresh water enters, and is highest at the mouth, where the seawater comes in. This type of salinity profile usually occurs in shallower estuaries, where the shallow depths allow complete mixing from the surface to the bottom.

Slightly stratified or partially mixed estuaries have similar salinity profiles to vertically mixed estuaries, where salinity increases from the head to the mouth, but there is also a slight increase in salinity with depth at any point. This usually occurs in deeper estuaries than those that are well-mixed, where waves and currents mix the surface water, but the mixing may not extend all the way to the bottom.

A salt wedge estuary occurs where the outflow of fresh water is strong enough to prevent the denser ocean water to enter through the surface, and where the estuary is deep enough that surface waves and turbulence have little mixing effect on the deeper water. Fresh water flows out along surface, salt water flows in at depth, creating a wedge shaped lens of seawater moving along the bottom. The surface water may remain mostly fresh throughout the estuary if there is no mixing, or it can become brackish depending on the level of mixing that occurs.

Highly stratified profiles are found in very deep estuaries, such as in fjords. Because of the depth, mixing of fresh and salt water only occurs near the surface, so in the upper layers salinity increases from the head to the mouth, but the deeper water is of standard ocean salinity.

Estuaries are very important commercially, as they are home to the majority of the world’s metropolitan areas, they serve as ports for industrial activity, and a large percentage of the world's population lives near estuaries. Estuaries are also very important biologically, especially in their role as the breeding grounds for many species of fish, birds, and invertebrates.
By Paul Webb, used under a CC-BY 4.0 international license. Download this book for free at https://rwu.pressbooks.pub/webboceanography/front-matter/preface/

