41 6.1 Earth’s Heat Budget
The balance of incoming and outgoing heat on Earth is referred to as its heat budget. As with any budget, to maintain constant conditions the budget must be balanced so that the incoming heat equals the outgoing heat. The heat budget of Earth appears below (Figure 6.1.1).
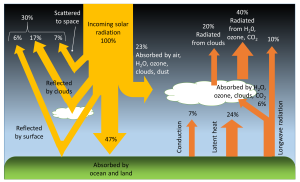
Of all of the solar energy reaching the Earth, about 30% is reflected back into space from the atmosphere, clouds, and surface of the Earth. Another 23% of the energy is absorbed by the water vapor, clouds, and dust in the atmosphere, where it is converted into heat. Just under half (47%) of the incoming solar radiation is absorbed by the land and ocean, and this energy heats up the Earth’s surface. The energy absorbed by the Earth returns to the atmosphere through three processes; conduction, radiation, and latent heat (phase change)(Figure 6.1.1).
Conduction is the transfer of heat through direct contact between the surface and the atmosphere. Air is a relatively poor thermal conductor (which means it is a good insulator), so conduction represents only a small part of the energy transfer between the Earth and the atmosphere; equal to about 7% of the incoming solar energy.
All bodies with a temperature above absolute zero (-273o C) radiate heat in the form of longwave, infrared radiation (see the electromagnetic spectrum in section 5.9). The warmed Earth is no exception, and about 16% of the original solar energy is radiated from the Earth to the atmosphere (Figure 6.1.1). Some of this radiated energy will dissipate into space, but a significant amount of heat will be absorbed by the atmosphere. This is the basis for the greenhouse effect (Figure 6.1.2). In the greenhouse effect, shortwave solar radiation passes through the atmosphere and reaches the Earth’s surface where it gets absorbed. When the radiation is re-emitted by the Earth, it is now in the form of long wavelength, infrared radiation, which does not easily pass through the atmosphere. Instead, this infrared radiation is absorbed by the atmosphere, particularly by the greenhouse gases such as CO2, methane, and water vapor. As a result, the atmosphere heats up. Without the greenhouse effect, the average temperature on Earth would be about -18o C, which is too cold for liquid water, and therefore life as we know it could not exist!
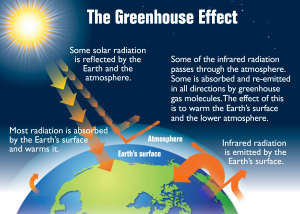
There is a great deal of concern about the greenhouse effect across the globe; not because of the presence of the effect itself, but because the effect is intensifying, causing climate change or global warming. Since the Industrial Revolution the atmospheric concentrations of the major greenhouse gases, particularly CO2 and methane, have increased dramatically due to industrialization, the burning of fossil fuels, and deforestation. At the same time, there has been rapid warming of the global climate; CO2 concentrations have increased more than 25% and global temperature has risen by 0.5o C over the past century. Unless production of these greenhouse gases is curbed, this rapid warming trend may continue, with potentially dire consequences. See section 6.5 for detailed information on the causes and effects of climate change.
The largest pathway for heat exchange between the land or oceans and the atmosphere is latent heat transferred through phase changes; heat released or absorbed when water moves between solid, liquid, and vapor forms (see section 5.1). Heat must be added to liquid water to make it evaporate, and when water vapor is formed, that heat is removed from the ocean and transferred to the atmosphere along with the water vapor. When water vapor condenses into rain, that heat is then returned to the oceans. The same process happens with the formation and melting of ice. Heat is absorbed by ice when it melts, and heat is released when ice forms, and these phase changes transfer heat between the oceans and the atmosphere.
To complete the heat budget, the heat that is absorbed by the atmosphere either directly from solar radiation or as a result of conduction, radiation and latent heat, is eventually radiated back into space (Figure 6.1.1).
Differential Heating of Earth’s Surface
If the Earth was a flat surface facing the sun, every part of that surface would receive the same amount of incoming solar radiation. However, because the Earth is a sphere, sunlight is not equally distributed over the Earth’s surface, so different regions of Earth will be heated to different degrees. This differential heating of Earth’s surface occurs for a number of reasons. First, because of the curvature of Earth, sunlight only falls perpendicularly to the surface at the center of the sphere (equatorial regions). At any other point on Earth, the angle between the surface and the incoming solar radiation is less than 90o. Because of this, the same amount of incoming solar radiation will be concentrated in a smaller area at the equator, but will be spread over a much larger area at the poles (Figure 6.1.3). Thus the tropics receive more intense sunlight and a greater amount of heating per unit of area than the polar regions.
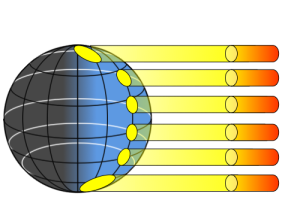
The angle at which sunlight strikes the Earth contributes to differential heating of the surface in an additional way. At the poles, because of the angle at which the solar energy strikes the surface, more of the light will glance off of the surface and the atmosphere and be reflected back into space. At the equator, the direct angle with which light reaches the surface results in more of the energy being absorbed rather than reflected. Finally, the poles reflect more solar energy than other parts of the Earth because the poles have a higher albedo. The albedo refers to reflectivity of a surface. Lighter surfaces are more reflective than darker surfaces (which absorb more energy), and therefore have a higher albedo. At the poles, the ice, snow and cloud cover create a much higher albedo, and the poles reflect more and absorb less solar energy than the lower latitudes. Through all of these mechanisms, the poles absorb much less solar radiation than equatorial regions, which is why the poles are cold and the tropics are very warm.
But there is an interesting twist to this global distribution of heat. The tropical regions actually receive more radiant heat than they emit, and the poles emit more heat than they receive (Figure 6.1.4). We should therefore expect that the tropics will be getting continually warmer, while the poles become increasingly cold. Yet this is not the case; so what is happening? Rather than the heat remaining isolated near the equator, about 20% of the heat from the tropics is transported to the poles before it is emitted. This large scale transport of energy moderates the climates at both extremes. The mechanisms for this heat transfer are ocean and atmospheric circulation, the topic of the next section.
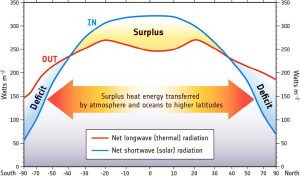
The idea of differential heating of the Earth’s surface is fundamental to understanding a wide range of oceanographic and atmospheric processes. This differential heating leads to atmospheric convection, which creates winds, which blow over the water and create waves and surface currents, and these currents influence nutrient distribution, which promotes primary production, which then supports the rest of the ocean ecosystem. So there’s a lot riding on the simple fact that more light reaches the tropics than the poles!
Tsunamis loom large in popular culture, but there are a number of misconceptions about these large waves. First, tsunamis have nothing to do with the tides, so it is a misnomer to refer to them as "tidal waves." There are actual tidal waves (see section 3.5), but they are not related to tsunamis. Second, the giant, curling wave that is taller than skyscrapers and destroys cities in science fiction movies is also a fabrication, as tsunamis do not behave that way, as described below.
Tsunamis are large waves that are usually the result of seismic activity, such as the rising or falling of the seafloor due to earthquakes, although volcanic activity and landslides can also cause tsunamis in the form of splash waves (see section 3.1). As the seafloor rises or falls, so does the water column above it, creating waves. Only vertical seismic disturbances cause tsunamis, not horizontal movements. These vertical seafloor movements are usually less than 10 m high, so the resulting wave will be of an equal or lesser height at sea. While the tsunamis have a relatively small height at the point of origin, they have very long wavelengths (100-200 km). Because of the long wavelength, they behave as shallow water waves throughout the entire ocean; the depth of the ocean is always shallower than half of their wavelength. As shallow water waves, their speed depends on water depth, but they can still travel at speeds over 750 km/hr (Figure 3.4.1)!
When tsunamis approach land, they behave just like any other wave; as the depth becomes shallower, the waves slow down and the wave height begins to increase. However, contrary to popular belief, tsunamis do not arrive on shore as giant, cresting waves. Since their wavelength is so long, it is impossible for their height to ever exceed 1/7 of their wavelength, so the waves don’t actually curl or break. Instead, they usually hit the shore as sudden surges of water causing a very rapid increase in sea level, like that of an enormous rise in tide. It may take several minutes for the wave to pass, during which time sea level can rise to 40 m higher than usual.
Large tsunamis occur every 2-3 years, with very large, damaging events happening every 15-20 years. The most devastating tsunami in terms of loss of life resulted from a magnitude 9 earthquake in Indonesia in 2004 (Figure 3.4.2), which created waves up to 33 m tall and left about 230,000 people dead in Indonesia, Thailand, and Sri Lanka. In 2011 a 9.0 magnitude earthquake in Japan triggered a tsunami up to 40.5 m high, which resulted in over 18,000 deaths. This earthquake also caused the Fukishima nuclear accident, and moved Japan about 8 inches closer to the U.S.

By Paul Webb, used under a CC-BY 4.0 international license. Download this book for free at https://rwu.pressbooks.pub/webboceanography/front-matter/preface/
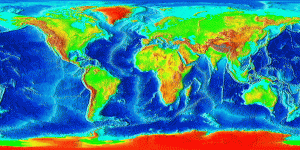
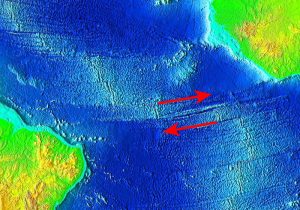
Divergent boundaries are spreading boundaries, where new oceanic crust is created to fill in the space as the plates move apart. Most divergent boundaries are located along mid-ocean oceanic ridges (although some are on land). The mid-ocean ridge system is a giant undersea mountain range, and is the largest geological feature on Earth; at 65,000 km long and about 1000 km wide, it covers 23% of Earth’s surface (Figure 2.5.1). Because the new crust formed at the plate boundary is warmer than the surrounding crust, it has a lower density so it sits higher on the mantle, creating the mountain chain. Running down the middle of the mid-ocean ridge is a rift valley 25-50 km wide and 1 km deep. Although oceanic spreading ridges appear to be curved features on Earth’s surface, in fact the ridges are composed of a series of straight-line segments, offset at intervals by faults perpendicular to the ridge, called transform faults. These transform faults make the mid-ocean ridge system look like a giant zipper on the seafloor (Figure 2.5.2). As we will see in section 3.7, movements along transform faults between two adjacent ridge segments are responsible for many earthquakes.
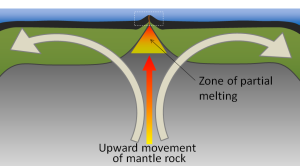
The crustal material created at a spreading boundary is always oceanic in character; in other words, it is igneous rock (e.g., basalt or gabbro, rich in ferromagnesian minerals), forming from magma derived from partial melting of the mantle caused by decompression as hot mantle rock from depth is moved toward the surface (Figure 2.5.3). The triangular zone of partial melting near the ridge crest is approximately 60 km thick and the proportion of magma is about 10% of the rock volume, thus producing crust that is about 6 km thick. This magma oozes out onto the seafloor to form pillow basalts, breccias (fragmented basaltic rock), and flows, interbedded in some cases with limestone or chert. Over time, the igneous rock of the oceanic crust gets covered with layers of sediment, which eventually become sedimentary rock.
Spreading is hypothesized to start within a continental area with up-warping or doming of crust related to an underlying mantle plume or series of mantle plumes. The buoyancy of the mantle plume material creates a dome within the crust, causing it to fracture. When a series of mantle plumes exists beneath a large continent, the resulting rifts may align and lead to the formation of a rift valley (such as the present-day Great Rift Valley in eastern Africa). It is suggested that this type of valley eventually develops into a linear sea (such as the present-day Red Sea), and finally into an ocean (such as the Atlantic). It is likely that as many as 20 mantle plumes, many of which still exist, were responsible for the initiation of the rifting of Pangaea along what is now the mid-Atlantic ridge.
There are multiple lines of evidence demonstrating that new oceanic crust is forming at these seafloor spreading centers:
1. Age of the crust:
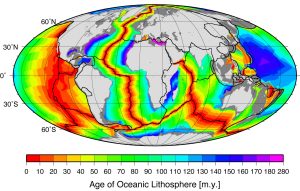
Comparing the ages of the oceanic crust near a mid-ocean ridge shows that the crust is youngest right at the spreading center, and gets progressively older as you move away from the divergent boundary in either direction, aging approximately 1 million years for every 20-40 km from the ridge. Furthermore, the pattern of crust age is fairly symmetrical on either side of the ridge (Figure 2.5.4).
The oldest oceanic crust is around 280 Ma in the eastern Mediterranean, and the oldest parts of the open ocean are around 180 Ma on either side of the north Atlantic. It may be surprising, considering that parts of the continental crust are close to 4,000 Ma old, that the oldest seafloor is less than 300 Ma. Of course, the reason for this is that all seafloor older than that has been either subducted (see section 3.6) or pushed up to become part of the continental crust. As one would expect, the oceanic crust is very young near the spreading ridges (Figure 2.5.4), and there are obvious differences in the rate of sea-floor spreading along different ridges. The ridges in the Pacific and southeastern Indian Oceans have wide age bands, indicating rapid spreading (approaching 10 cm/year on each side in some areas), while those in the Atlantic and western Indian Oceans are spreading much more slowly (less than 2 cm/year on each side in some areas).
2. Sediment thickness:
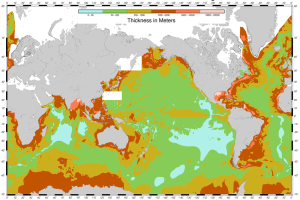
With the development of seismic reflection sounding (similar to echo sounding described in section 1.4) it became possible to see through the seafloor sediments and map the bedrock topography and crustal thickness. Hence sediment thicknesses could be mapped, and it was soon discovered that although the sediments were up to several thousands of meters thick near the continents, they were relatively thin — or even non-existent — in the ocean ridge areas (Figure 2.5.5). This makes sense when combined with the data on the age of the oceanic crust; the farther from the spreading center the older the crust, the longer it has had to accumulate sediment, and the thicker the sediment layer. Additionally, the bottom layers of sediment are older the farther you get from the ridge, indicating that they were deposited on the crust long ago when the crust was first formed at the ridge.
3. Heat flow:
Measurements of rates of heat flow through the ocean floor revealed that the rates are higher than average (about 8x higher) along the ridges, and lower than average in the trench areas (about 1/20th of the average). The areas of high heat flow are correlated with upward convection of hot mantle material as new crust is formed, and the areas of low heat flow are correlated with downward convection at subduction zones.
4. Magnetic reversals:
In section 2.2 we saw that rocks could retain magnetic information that they acquired when they were formed. However, Earth's magnetic field is not stable over geological time. For reasons that are not completely understood, the magnetic field decays periodically and then becomes re-established. When it does re-establish, it may be oriented the way it was before the decay, or it may be oriented with the reversed polarity. During periods of reversed polarity, a compass would point south instead of north. Over the past 250 Ma, there have a few hundred magnetic field reversals, and their timing has been anything but regular. The shortest ones that geologists have been able to define lasted only a few thousand years, and the longest one was more than 30 million years, during the Cretaceous (Figure 2.5.6). The present “normal” event has persisted for about 780,000 years.


Beginning in the 1950s, scientists started using magnetometer readings when studying ocean floor topography. The first comprehensive magnetic data set was compiled in 1958 for an area off the coast of British Columbia and Washington State. This survey revealed a mysterious pattern of alternating stripes of low and high magnetic intensity in sea-floor rocks (Figure 2.5.7). Subsequent studies elsewhere in the ocean also observed these magnetic anomalies, and most importantly, the fact that the magnetic patterns are symmetrical with respect to ocean ridges. In the 1960s, in what would become known as the Vine-Matthews-Morley (VMM) hypothesis, it was proposed that the patterns associated with ridges were related to the magnetic reversals, and that oceanic crust created from cooling basalt during a normal event would have polarity aligned with the present magnetic field, and thus would produce a positive anomaly (a black stripe on the sea-floor magnetic map), whereas oceanic crust created during a reversed event would have polarity opposite to the present field and thus would produce a negative magnetic anomaly (a white stripe). The widths of the anomalies varied according to the spreading rates characteristic of the different ridges. This process is illustrated in Figure 2.5.8. New crust is formed (panel a) and takes on the existing normal magnetic polarity. Over time, as the plates continue to diverge, the magnetic polarity reverses, and new crust formed at the ridge now takes on the reversed polarity (white stripes in Figure 2.5.8). In panel b, the poles have reverted to normal, so once again the new crust shows normal polarity before moving away from the ridge. Eventually, this creates a series of parallel, alternating bands of reversals, symmetrical around the spreading center (panel c).

The most obvious feature of the oceans is that they contain water. Water is so ubiquitous that it may not seem like a very interesting substance, but it has many unique properties that impact global oceanographic and climatological processes. Many of these processes are due to hydrogen bonds forming between water molecules.
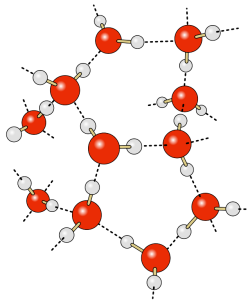
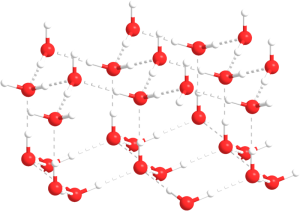
The water molecule consists of two hydrogen atoms and one oxygen atom. The electrons responsible for the bonds between the atoms are not distributed equally throughout the molecule, so that the hydrogen ends of water molecules have a slight positive charge, and the oxygen end has a slight negative charge, making water a polar molecule. The negative oxygen side of the molecule forms an attraction to the positive hydrogen end of a neighboring molecule. This rather weak force of attraction is called a hydrogen bond (Figure 5.1.1). If not for hydrogen bonds, water would vaporize at -68o C, meaning liquid water (and thus life) could not exist on Earth. These hydrogen bonds are responsible for some of water’s unique properties:
1. Water is the only substance to naturally exist in a solid, liquid, and gaseous form under the normal range of temperatures and pressures found on Earth. This is due to water’s relatively high freezing and vaporizing points (see below).
2. Water has a high heat capacity, which is the amount of heat that must be added to raise its temperature. Specific heat is the heat required to raise the temperature of 1 g of a substance by 1o C. Water has the highest specific heat of any liquid except ammonia (Table 5.1.1).
Table 5.1.1 Specific heat values for a number of common substances
| Specific Heat (calories/g/Co) | |
|---|---|
| Ammonia | 1.13 |
| Water | 1.00 |
| Acetone | 0.51 |
| Grain Alcohol | 0.23 |
| Aluminum | 0.22 |
| Copper | 0.09 |
| Silver | 0.06 |
Water is therefore one of the most difficult liquids to heat or cool; it can absorb large amounts of heat without increasing its temperature. Remember that temperature reflects the average kinetic energy of the molecules within a substance; the more vigorous the motion, the higher the temperature. In water, the molecules are held together by hydrogen bonds, and these bonds must be overcome to allow the molecules to move freely. When heat is added to water the energy must first go to breaking the hydrogen bonds before the temperature can begin to rise. Therefore, much of the added heat is absorbed by breaking H bonds, not by increasing the temperature, giving water a high heat capacity.
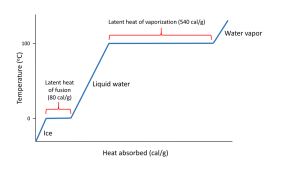
Hydrogen bonds also give water a high latent heat; the heat required to undergo a phase change from solid to liquid, or liquid to gas. The latent heat of fusion is the heat required to go from solid to liquid; 80 cal/g in the case of ice melting to water. Ice is a solid because hydrogen bonds hold the water molecules into a solid crystal lattice (see below). As ice is heated, the temperature rises up to 0o C. At that point, any additional heat goes to melting the ice by breaking the hydrogen bonds, not to increasing the temperature. So as long as ice is present, the water temperature will not increase. This is why your drink will remain cold as long as it contains ice; any heat absorbed goes to melting the ice, not to warming the drink.
When all of the ice is melted, additional heat will increase the temperature of the water 1o C for each calorie of heat added, until it reaches 100o C. At that point, any additional heat goes to overcoming the hydrogen bonds and turning the liquid water into water vapor, rather than increasing the water temperature. The heat required to evaporate liquid water into water vapor is the latent heat of vaporization which has a value of 540 cal/g (Figure 5.1.2).
The high heat capacity of water helps regulate global climate, as the oceans slowly absorb and release heat, preventing rapid swings in temperature (see section 8.1). It also means that aquatic organisms aren't as subjected to the same rapid temperature changes as terrestrial organisms. A deep ocean organism may not experience more than a 0.5o C change in temperature over its entire life, while a terrestrial species may encounter changes of more than 20o C in a single day!
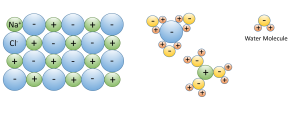
3. Water dissolves more substances than any other liquid; it is a "universal solvent", which is why so many substances are dissolved in the ocean. Water is especially good at dissolving ionic salts; molecules made from oppositely charged ions such as NaCl (Na+ and Cl-). In water, the charged ions attract the polar water molecules. The ions get surrounded by a layer of water molecules, weakening the bond between the ions by up to 80 times. With the bonds weakened between ions, the substance dissolves (Figure 5.1.3).
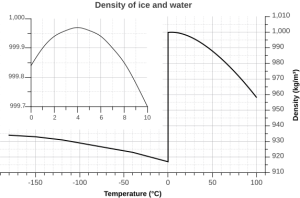
4. The solid phase is less dense than the liquid phase. In other words, ice floats. Most substances are denser in the solid form than in the liquid form, as their molecules are more closely packed together as a solid. Water is an exception: the density of fresh water is 1.0 g/cm3, while the density of ice is 0.92 g/cm3, and once again, this is due to the action of hydrogen bonds.
As water temperature cools the molecules slow down, eventually slowing enough that hydrogen bonds can form and hold the water molecules in a crystal lattice. The molecules in the lattice are spaced farther apart than the molecules in liquid water, which makes ice less dense than liquid water (Figure 5.1.4). This is familiar to anyone who has ever left a full water bottle in the freezer, only to have it burst as the water freezes and expands.
But the relationship between temperature and water density is not a simple linear one. As water cools, its density increases as expected, as the water molecules slow down and get closer together. However, fresh water reaches its maximum density at a temperature of 4o C, and as it cools beyond that point its density declines as the hydrogen bonds begin to form and the intermolecular spacing increases (Figure 5.1.5 inset). The density continues to decline until the temperature reaches 0o C and ice crystals form, reducing the density dramatically (Figure 5.1.5).
There are a number of important implications to ice being less dense than water. Ice floating on the surface of the ocean helps regulate ocean temperatures, and therefore global climate, by influencing the amount of sunlight that is reflected rather than absorbed (see section 5.6). On a smaller scale, surface ice can prevent lakes and ponds from freezing solid during the winter. As fresh surface water cools, the water gets denser, and sinks to the bottom. The new surface water then cools and sinks, and the process is repeated in what is referred to as overturning, with denser water sinking and less dense water moving to the surface only to be cooled and sink itself. In this way, the entire body of water is cooled somewhat evenly. This process continues until the surface water cools below 4o C. Below 4o C, the water becomes less dense as it cools, so it no longer sinks. Instead, it remains as the surface, getting colder and less dense, until it freezes at 0o C. Once fresh water freezes, the ice floats and insulates the rest of the water beneath it, reducing further cooling. The densest bottom water is still at 4o C, so it does not freeze, allowing the bottom of a lake or pond to remain unfrozen (which is good news for the animals living there) no matter how cold it gets outside.
The dissolved salts in seawater inhibit the formation of the crystal lattice, and therefore make it harder for ice to form. So seawater has a freezing point of about -2o C (depending on salinity), and freezes before a temperature of maximum density is reached. Thus seawater will continue to sink as it gets colder, until it finally freezes.
5. Water has a very high surface tension, the highest of any liquid except mercury (Table 5.1.2). Water molecules are attracted to each other by hydrogen bonds. For molecules not at the water surface, they are surrounded by other water molecules in all directions, so the attractive forces are evenly distributed in all directions. But for molecules at the surface there are few adjacent molecules above them, only below, so all of the attractive forces are directed inwards, away from the surface (Figure 5.1.6). This inwards force is what causes water droplets to take on a spherical shape, and water to bead up on a surface, as the spherical shape provides the minimum possible surface area. These attractive forces also cause the surface of the water to act like an elastic "skin" which allows things like insects to sit on the water's surface without sinking.
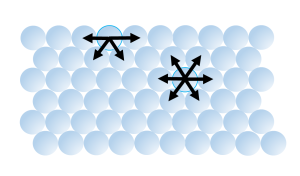
Table 5.1.2 Surface tensions of various liquids
| Liquid | Surface Tension (millinewton/meter) | Temperature oC |
|---|---|---|
| Mercury | 487.00 | 15 |
| Water | 71.97 | 25 |
| Glycerol | 63.00 | 20 |
| Acetone | 23.70 | 20 |
| Ethanol | 22.27 | 20 |
By Paul Webb, used under a CC-BY 4.0 international license. Download this book for free at https://rwu.pressbooks.pub/webboceanography/front-matter/preface/
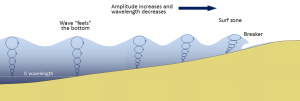
Most of the waves discussed in the previous section referred to deep water waves in the open ocean. But what happens when these waves move towards shore and encounter shallow water? Remember that in deep water, a wave’s speed depends on its wavelength, but in shallow water wave speed depends on the depth (section 3.1). When waves approach the shore they will "touch bottom" at a depth equal to half of their wavelength; in other words, when the water depth equals the depth of the wave base (Figure 3.3.1). At this point their behavior will begin to be influenced by the bottom.
When the wave touches the bottom, friction causes the wave to slow down. As one wave slows down, the one behind it catches up to it, thus decreasing the wavelength. However, the wave still contains the same amount of energy, so while the wavelength decreases, the wave height increases. Eventually the wave height exceeds 1/7 of the wavelength, and the wave becomes unstable and forms a breaker. Often breakers will start to curl forwards as they break. This is because the bottom of the wave begins to slow down before the top of the wave, as it is the first part to encounter the seafloor. So the crest of the wave gets “ahead” of the rest of the wave, but has no water underneath it to support it (Figure 3.3.1).
There are three main types of breakers: spilling, plunging, and surging. These are related to the steepness of the bottom, and how quickly the wave will slow down and its energy will get dissipated.
- Spilling breakers form on gently sloping or flatter beaches, where the energy of the wave is dissipated gradually. The wave slowly increases in height, then slowly collapses on itself (Figure 3.3.2). For surfers, these waves provide a longer ride, but they are less exciting.

- Plunging breakers form on more steeply-sloped shores, where there is a sudden slowing of the wave and the wave gets higher very quickly. The crest outruns the rest of the wave, curls forwards and breaks with a sudden loss of energy (Figure 3.3.3). These are the “pipeline” waves that surfers seek out.

- Surging breakers form on the steepest shorelines. The wave energy is compressed very suddenly right at the shoreline, and the wave breaks right onto the beach (Figure 3.3.4). These waves give too short (and potentially painful) a ride for surfers to enjoy.

Wave Refraction
Swell can be generated anywhere in the ocean and therefore can arrive at a beach from almost any direction. But if you have ever stood at the shore you have probably noticed that the waves usually approach the shore somewhat parallel to the coast. This is due to wave refraction. If a wave front approaches shore at an angle, the end of the wave front closest to shore will touch bottom before the rest of the wave. This will cause that shallower part of the wave to slow down first, while the rest of the wave that is still in deeper water will continue on at its regular speed. As more and more of the wave front encounters shallower water and slows down, the wave font refracts and the waves tend to align themselves nearly parallel to the shoreline (they are refracted towards the region of slower speed). As we will see in section 5.2, the fact that the waves do not arrive perfectly parallel to the beach causes longshore currents and longshore transport that run parallel to the shore.
Refraction can also explain why waves tend to be larger off of points and headlands, and smaller in bays. A wave front approaching shore will touch the bottom off of the point before it touches bottom in a bay. Once again, the shallower part of the wave front will slow down, and cause the rest of the wave front to refract towards the slower region (the point). Now all of the initial wave energy is concentrated in a relatively small area off of the point, creating large, high energy waves (Figure 3.3.6). In the bay, the refraction has caused the wave fronts to refract away from each other, dispersing the wave energy, and leading to calmer water and smaller waves. This makes the large waves of a “point break” ideal for surfing, while water is calmer in a bay, which is where people would launch a boat. This difference in wave energy also explains why there is net erosion on points, while sand and sediments get deposited in bays (see section 5.3).
By Paul Webb, used under a CC-BY 4.0 international license. Download this book for free at https://rwu.pressbooks.pub/webboceanography/front-matter/preface/
-
- a streamlined body shape for more efficient movement through the water
- a high metabolic rate that generates a lot of heat and layers of fat and, in some cases, fur, to conserve this heat
- modifications to their respiratory system to collect and retain large volumes of oxygen to allow deep and repetitive dives
- osmotic adaptations that free them from any requirement for fresh water
Order Cetacea: the whales
- Whales also have special adaptations, such as:
- A thick layer of blubber
- Their nostrils have migrated to the top of the head so that the animal doesn't have to come completely out of the water to breathe
- Large, deeply convoluted brains
- A special skin that "gives" to dampen out irregularities in water flow
- Bronchial cartilage that supports their lungs against pressure during deep dives
- Their blood is especially rich in hemoglobin to store more oxygen for diving
- They can slow their heartbeat while diving
- The blood supply can be reduced to all but the vital organs while diving, to conserve oxygen
Whale groups come in two 'flavors' (sub-Orders) – Odontocetes (toothed whales) and Mysticetes (baleen whales)
- Sperm whales are the largest of the toothed whales, reaching lengths up to 60 ft
- It also possesses the largest brain ever to have evolved on Earth
- They can dive to greater depths than any other air-breathing animal – to 3000 ft – and can stay down for over an hour
- Their head is filled with up to a ton of clear oil, presumably used to focus sound waves passing to their prey and back
Mysticetes (baleen whales): Also known as baleen whales, the Mysticetes are considered to be more highly evolved than the Odontocetes. Baleen is a bristly, bush, fibrous substance set in the jaws in overlapping plates; it looks like a gigantic comb.
- They feed on small planktonic arthropods (krill)
- Baleen is a straining mechanism
- The whale takes in a big gulp of water, closes its jaws, raises its tongue to expel the water, and the food is caught on the surface of the baleen
- The food is swallowed after being licked from the baleen by the whale's giant tongue
- Baleen whales include the blue, humpback and gray, among others

- The blue whale is probably the largest animal ever to have lived on Earth
- They're usually described as up to about 100 feet in length and up to about 200 tons
- this compares to three railroad cars in length and about 1600 people in weight
- Blue whales feed on krill, which are tiny shrimp-like crustaceans
- A mature blue whale consumes about 4 tons of krill per day when it's feeding
- For a 7 to 8 month period; it fasts when it is in tropical waters
- From December through April, the blue whale gorges on krill around the Antarctic
Humpback whale
- Humpbacks are stocky and seldom exceed 50 ft in length
- They're generally black above and white below, with extremely long, wing-like flippers
- They've become known for their "song", which are sounds with definite patterns and sequences
- All the whales in a given population sing the same song, but the song changes every year
- Humpbacks are also very acrobatic, at times leaping completely out of the water
- It is estimated that there are no more than 10,000 humpbacks surviving today
Gray whale
- The Gray whale is the only large whale with a heavily mottled appearance and a knobby ridge down the back
- Its 'natural' color is dark gray or black, but it's covered by a profusion of spots, scars, patches, and clusters of barnacles, which gives it a mottled, grayish appearance
- The Gray whale makes the longest migration of any mammal, an annual round-trip of some 10,000 miles from the Bering and Chukchi seas in the high Arctic to the warm lagoons of Baja California
- They were easily caught by whalers and almost became extinct in the 1940's
- Given full protection in 1946, they've made a successful comeback and their population, estimated at about 21,000, is now believed to be inline with the carrying capacity of their range
- The Gray whale is the most heavily parasitized of all cetaceans – playing host to three species of lice, some over an inch long – in one case, more than 100,000 of one species of louse were removed from a single whale
Dr. Cristina Cardona
If one thing has been constant about Earth’s climate over geological time, it is its constant change. In the geological record, we can see this in the evidence of glaciations in the distant past, and we can also detect periods of extreme warmth by looking at the isotope composition of seafloor sediments. Not only has the climate changed frequently, the temperature fluctuations have been very significant. Today’s mean global temperature is about 15°C. However, during its coldest periods, the global mean was as cold as -50°C, while at various times during the Paleozoic and Mesozoic and during the Paleocene-Eocene thermal maximum, it was close to 30°C.
There are two parts to climate change, the first one is known as climate forcing, which is when conditions change to give the climate a little nudge in one direction or the other. The second part of climate change, and the one that typically does most of the work, is what we call a feedback. When a climate forcing changes the climate a little, a whole series of environmental changes take place, many of which either exaggerate the initial change (positive feedback), or suppress the change (negative feedback).
An example of a climate forcing mechanism is the increase in the amount of carbon dioxide (CO2) in the atmosphere that results from our use of fossil fuels. CO2 traps heat in the atmosphere and leads to climate warming. Warming changes vegetation patterns; contributes to the melting of snow, ice, and permafrost; causes sea level to rise; reduces the solubility of CO2 in sea water; and has a number of other minor effects. Most of these changes contribute to more warming. Melting of permafrost, for example, is a strong positive feedback because frozen soil contains trapped organic matter that is converted to CO2 and methane (CH4) when the soil thaws. Both these gases accumulate in the atmosphere and add to the warming effect. On the other hand, if warming causes more vegetation growth, that vegetation should absorb CO2, thus reducing the warming effect, which would be a negative feedback. Under our current conditions — a planet that still has lots of glacial ice and permafrost — most of the feedbacks that result from a warming climate are positive feedbacks and so the climate changes that we cause get naturally amplified by natural processes.
Natural Climate Forcing
Natural climate forcing has been going on throughout geological time. A wide range of processes has been operating at widely different time scales, from a few years to billions of years. The longest-term natural forcing variation is related to the evolution of the Sun. Like most other stars of a similar mass, our Sun is evolving. For the past 4.6 billion years, its rate of nuclear fusion has been increasing, and it is now emitting about 40% more energy (as light) than it did at the beginning of geological time. A difference of 40% is big, so it’s a little surprising that the temperature on Earth has remained at a reasonable and habitable temperature for all of this time. The mechanism for that relative climate stability has been the evolution of our atmosphere from one that was dominated by CO2, and also had significant levels of CH4 — both greenhouse gasses — to one with only a few hundred parts per million of CO2 and just under 1 part per million of CH4. Those changes to our atmosphere have been no accident; over geological time, life and its metabolic processes have evolved (such as the evolution of photosynthetic bacteria that consume CO2) and changed the atmosphere to conditions that remained cool enough to be habitable.
The position of the Earth relative to the Sun is another important component of natural climate forcing. Earth’s orbit around the Sun is nearly circular, but like all physical systems, it has natural oscillations. First, the shape of the orbit changes on a regular time scale (close to 100,000 years) from being close to circular to being very slightly elliptical. But the circularity of the orbit is not what matters; it is the fact that as the orbit becomes more elliptical, the position of the Sun within that ellipse becomes less central or more eccentric (Figure 6.5.1a). Eccentricity is important because when it is high, the Earth-Sun distance varies more from season to season than it does when eccentricity is low.
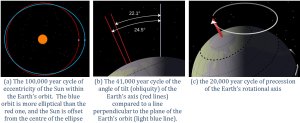
Second, Earth rotates around an axis through the North and South Poles, and that axis is at an angle to the plane of Earth’s orbit around the Sun (Figure 6.5.1b). The angle of tilt (also known as obliquity) varies on a time scale of 41,000 years. When the angle is at its maximum (24.5°), Earth’s seasonal differences are accentuated. When the angle is at its minimum (22.1°), seasonal differences are minimized. The current hypothesis is that glaciation is favored at low seasonal differences as summers would be cooler and snow would be less likely to melt and more likely to accumulate from year to year. Third, the direction in which Earth’s rotational axis points also varies, on a time scale of about 20,000 years (Figure 6.5.1c). This variation, known as precession, means that although the North Pole is presently pointing to the star Polaris (the pole star), in 10,000 years it will point to the star Vega. The importance of eccentricity, tilt, and precession to Earth’s climate cycles (now known as Milankovitch Cycles) was first pointed out by Yugoslavian engineer and mathematician Milutin Milankovitch in the early 1900s. Milankovitch recognized that although the variations in the orbital cycles did not affect the total amount of insolation (light energy from the Sun) that Earth received, it did affect where on Earth that energy was strongest.
Volcanic eruptions don’t just involve lava flows and exploding rock fragments; various particulates and gases are also released, the important ones being sulphur dioxide and CO2. Sulphur dioxide is an aerosol that reflects incoming solar radiation and has a net cooling effect that is short lived (a few years in most cases, as the particulates settle out of the atmosphere within a couple of years), and doesn’t typically contribute to longer-term climate change. Volcanic CO2 emissions can contribute to climate warming but only if a greater-than-average level of volcanism is sustained over a long time (at least tens of thousands of years). It is widely believed that the catastrophic end-Permian extinction (at 250 Ma) resulted from warming initiated by the eruption of the massive Siberian Traps over a period of at least a million years.
Ocean currents are important to climate, and currents also have a tendency to oscillate. Glacial ice cores show clear evidence of changes in the Gulf Stream that affected global climate on a time scale of about 1,500 years during the last glaciation. The east-west changes in sea-surface temperature and surface pressure in the equatorial Pacific Ocean, known as the El Niño Southern Oscillation or ENSO varies on a much shorter time scale of between two and seven years. These variations tend to garner the attention of the public because they have significant climate implications in many parts of the world. The strongest El Niños in recent decades were in 1983, 1998, and 2015 and those were very warm years from a global perspective. During a strong El Niño, the equatorial Pacific sea-surface temperatures are warmer than normal and heat the atmosphere above the ocean, which leads to warmer-than-average global temperatures.
Climate Feedbacks
As already stated, climate feedbacks are critically important in amplifying weak climate forcings into full-blown climate changes. Since Earth still has a very large volume of ice, mostly in the continental ice sheets of Antarctica and Greenland, but also in alpine glaciers and permafrost, melting is one of the key feedback mechanisms. Melting of ice and snow leads to several different types of feedbacks, an important one being a change in albedo, or the reflectivity of a surface. Earth’s various surfaces have widely differing albedos, expressed as the percentage of light that reflects off a given material. This is important because most solar energy that hits a very reflective surface is not absorbed and therefore does little to warm Earth. Water in the oceans or on a lake is one of the darkest surfaces, reflecting less than 10% of the incident light, while clouds and snow or ice are among the brightest surfaces, reflecting 70% to 90% of the incident light. When sea ice melts, as it has done in the Arctic Ocean at a disturbing rate over the past decade, the albedo of the area affected changes dramatically, from around 80% down to less than 10%. Much more solar energy is absorbed by the water than by the pre-existing ice, and the temperature increase is amplified. The same applies to ice and snow on land, but the difference in albedo is not as great. When ice and snow on land melt, sea level rises. (Sea level is also rising because the oceans are warming and that increases their volume). A higher sea level means a larger proportion of the planet is covered with water, and since water has a lower albedo than land, more heat is absorbed and the temperature goes up a little more. Since the last glaciation, sea-level rise has been about 125 m; a huge area that used to be land is now flooded by heat-absorbent seawater. During the current period of anthropogenic climate change, sea level has risen only about 20 cm, and although that doesn’t make a big change to albedo, sea-level rise is accelerating.
Most of northern Canada, Alaska, Russia, and Scandinavia has a layer of permafrost that ranges from a few centimeters to hundreds of meters in thickness. Permafrost is a mixture of soil and ice and it also contains a significant amount of trapped organic carbon that is released as CO2 and CH4 when the permafrost breaks down. Because the amount of carbon stored in permafrost is in the same order of magnitude as the amount released by burning fossil fuels, this is a feedback mechanism that has the potential to equal or surpass the forcing that has unleashed it. In some polar regions, including northern Canada, permafrost includes methane hydrate, a highly concentrated form of CH4 trapped in solid form. Breakdown of permafrost releases this CH4. Even larger reserves of methane hydrate exist on the seafloor, and while it would take significant warming of ocean water down to a depth of hundreds of meters, this too is likely to happen in the future if we don’t limit our impact on the climate. There is strong isotopic evidence that the Paleocene-Eocene thermal maximum was caused, at least in part, by a massive release of sea-floor methane hydrate.
There is about 45 times as much carbon in the ocean (as dissolved bicarbonate ions, HCO3-) as there is in the atmosphere (as CO2), and there is a steady exchange of carbon between the two reservoirs (see section 5.5). But the solubility of CO2 in water decreases as the temperature goes up. In other words, the warmer it gets, the more oceanic bicarbonate that gets transferred to the atmosphere as CO2. That makes CO2 solubility another positive feedback mechanism. Vegetation growth responds positively to both increased temperatures and elevated CO2 levels, and so in general, it represents a negative feedback to climate change because the more the vegetation grows, the more CO2 is taken from the atmosphere. But it’s not quite that simple, because when trees grow bigger and more vigorously, forests become darker (they have lower albedo) so they absorb more heat. Furthermore, climate warming isn’t necessarily good for vegetation growth; some areas have become too hot, too dry, or even too wet to support the plant community that was growing there, and it might take centuries for something to replace it successfully. All of these positive (and negative) feedbacks work both ways. For example, during climate cooling, growth of glaciers leads to higher albedos, and formation of permafrost results in storage of carbon that would otherwise have returned quickly to the atmosphere.
Anthropogenic Climate Change
When we talk about anthropogenic climate change, we are generally thinking of the industrial era, which really got going when we started using fossil fuels (coal to begin with, and later oil and natural gas) to drive machinery and trains, and to generate electricity. That was around the middle of the 18th century. The issue with fossil fuels is that they involve burning carbon that was naturally stored in the crust over hundreds of millions of years as part of Earth’s process of counteracting the warming Sun.
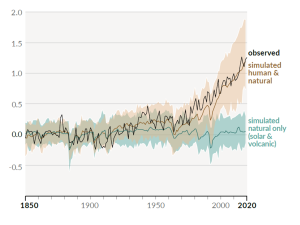
A rapidly rising population, the escalating level of industrialization and mechanization of our lives, and an increasing dependence on fossil fuels have driven the anthropogenic climate change of the past century. The trend of mean global temperatures since 1850 is shown in Figure 6.5.2. For approximately the past 55 years, the temperature has increased at a relatively steady and disturbingly rapid rate, especially compared to past changes. The average temperature now is approximately 1.1°C higher than before industrialization, and two-thirds of this warming has occurred since 1975.
The Intergovernmental Panel on Climate Change (IPCC), established by the United Nations in 1988, is responsible for reviewing the scientific literature on climate change and issuing periodic reports on several topics, including the scientific basis for understanding climate change, our vulnerability to observed and predicted climate changes, and what we can do to limit climate change and minimize its impacts. Figure 6.5.3, from the sixth report of the IPCC, issued in preliminary form in 2021, shows the relative contributions of various greenhouse gases and other factors to current climate forcing, based on the changes from levels that existed in 1750.
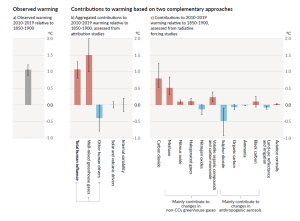
The biggest anthropogenic contributor to warming is the emission of CO2, which accounts for 50% of positive forcing. CH4 and its atmospheric derivatives (CO2, H2O, and O3) account for 29%, and the halocarbon gases (mostly leaked from air-conditioning appliances) and nitrous oxide (N2O) (from burning fossils fuels) account for 5% each. Carbon monoxide (CO) (also produced by burning fossil fuels) accounts for 7%, and the volatile organic compounds other than methane (NMVOC) account for 3%. CO2 emissions come mostly from coal- and gas-fired power stations, motorized vehicles (cars, trucks, and aircraft), and industrial operations (e.g., smelting), and indirectly from forestry. CH4 emissions come from production of fossil fuels (escape from coal mining and from gas and oil production), livestock farming (mostly beef), landfills, and wetland rice farming. N2O and CO come mostly from the combustion of fossil fuels. In summary, close to 70% of our current greenhouse gas emissions come from fossil fuel production and use, while most of the rest comes from agriculture and landfills. Figure 6.5.4 shows the IPCC’s projections for temperature increases over the next 100 years as a result of these increasing greenhouse gases.

Impacts of Climate Change
We’ve all experienced the effects of climate change over the past decade. However, it’s not straightforward for climatologists to make the connection between a warming climate and specific weather events, and most are justifiably reluctant to ascribe any specific event to climate change. In this respect, the best measures of climate change are those that we can detect over several decades, such as the temperature changes shown in Figure 6.5.2, or the sea level rise shown in Figure 6.5.5. As already stated, sea level has risen approximately 20 cm since 1750, and that rise is attributed to both warming (and therefore expanding) seawater and melting glaciers and other land-based snow and ice (melting of sea ice does not contribute directly to sea level rise as it is already floating in the ocean).

Projections for sea level rise to the end of this century vary widely. This is in large part because we do not know which of the above climate change scenarios (Figure 6.5.4) we will most closely follow, but many are in the range from 0.5 m to 2.0 m. One of the problems in predicting sea level rise is that we do not have a strong understanding of how large ice sheets, such as Greenland and Antarctica, will respond to future warming. Another issue is that the oceans don’t respond immediately to warming. For example, with the current amount of warming, we are already committed to a future sea level rise of between 1.3 m and 1.9 m, even if we could stop climate change today. This is because it takes decades to centuries for the existing warming of the atmosphere to be transmitted to depth within the oceans and to exert its full impact on large glaciers. Most of that committed rise would take place over the next century, but some would be delayed longer. And for every decade that the current rates of climate change continue, that number increases by another 0.3 m. In other words, if we don’t make changes quickly, by the end of this century we’ll be locked into 3 m of future sea level rise. In a 2008 report, the Organization for Economic Co-operation and Development (OECD) estimated that by 2070 approximately 150 million people living in coastal areas could be at risk of flooding due to the combined effects of sea level rise, increased storm intensity, and land subsidence. The assets at risk (buildings, roads, bridges, ports, etc.) are in the order of $35 trillion ($35,000,000,000,000). Countries with the greatest exposure of population to flooding are China, India, Bangladesh, Vietnam, U.S.A., Japan, and Thailand. Some of the major cities at risk include Shanghai, Guangzhou, Mumbai, Kolkata, Dhaka, Ho Chi Minh City, Tokyo, Miami, and New York.
One of the other risks for coastal populations, besides sea level rise, is that climate warming is also associated with an increase in the intensity of tropical storms (e.g., hurricanes or typhoons; see section 6.4), which almost always bring serious flooding from intense rain and storm surges. Some recent examples are New Orleans in 2005 with Hurricane Katrina, and New Jersey and New York in 2012 with Hurricane Sandy. Tropical storms get their energy from the evaporation of warm seawater in tropical regions. In the Atlantic Ocean, this takes place between 8° and 20° N in the summer. Figure 6.5.6 shows the variations in the sea-surface temperature (SST) of the tropical Atlantic Ocean (in blue) versus the amount of power represented by Atlantic hurricanes between 1950 and 2008 (in red). Not only has the overall intensity of Atlantic hurricanes increased with the warming since 1975, but the correlation between hurricanes and sea-surface temperatures is very strong over that time period.

The geographical ranges of diseases and pests, especially those caused or transmitted by insects, have been shown to extend toward temperate regions because of climate change. West Nile virus and Lyme disease are two examples that already directly affect North Americans, while dengue fever could be an issue in the future (dengue became a "nationally notifiable condition" in the United States in 2010). For several weeks in July and August of 2010, a massive heat wave affected western Russia, especially the area southeast of Moscow, and scientists have stated that climate change was a contributing factor. Temperatures soared to over 40°C, as much as 12°C above normal over a wide area, and wildfires raged in many parts of the country. Over 55,000 deaths are attributed to the heat and to respiratory problems associated with the fires. A summary of the impacts of climate change on natural disasters is given in Figure 6.5.7. The major types of disasters related to climate are floods and storms, but the health implications of extreme temperatures are also becoming a great concern. In the decade 1971 to 1980, extreme temperatures were the fifth most common natural disasters; by 2001 to 2010, they were the third most common.


