38 5.7 Density
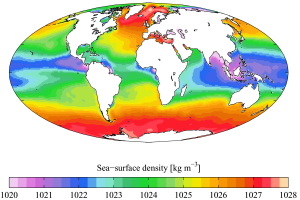
Density refers to the amount of mass per unit volume, such as grams per cubic centimeter (g/cm3). The density of fresh water is 1 g/cm3 at 4o C (see section 5.1), but the addition of salts and other dissolved substances increases surface seawater density to between 1.02 and 1.03 g/cm3. The density of seawater can be increased by reducing its temperature, increasing its salinity, or increasing the pressure. Pressure has the least impact on density as water is fairly incompressible, so pressure effects are not very significant except at extreme depths. However, if not for the slight compression of water due to pressure, sea level would be approximately 50 m higher than it is today! That leaves temperature and salinity as the primary factors determining density, and of these, temperature has the greatest impact (Figure 5.7.1).
Since temperature has the greatest effect on density, density profiles are usually mirror images of temperature profiles (Figure 5.7.2). Density is lowest at the surface, where the water is the warmest. As depth increases, there is a region of rapidly increasing density with increasing depth, which is called the pycnocline. The pycnocline coincides with the thermocline, as it is the sudden decrease in temperature that leads to the increase in density. Below the pycnocline, density may be fairly constant (as is temperature), or it may continue to increase slightly towards the bottom.
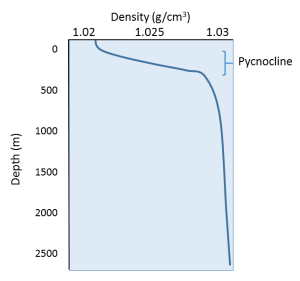
The profile above represents a stable state, or a high degree of stratification, where the warm, low density layer sits atop the colder, denser layer. If denser water happened to form at the surface, the water masses would be unstable, and the denser water would sink to the bottom, to be replaced by less dense water at the surface. This vertical movement of water masses based on density (as determined by temperature and salinity) is referred to as thermohaline circulation, which is the topic of section 7.8. By creating a stratified water column, the thermocline and pycnocline together create a barrier that prevents mixing between the warmer, less dense surface water and the colder, denser bottom water. In this way, nutrient-rich deep water may be prevented from coming to the surface to support primary production.
As with temperature, there are also latitudinal differences in density. In the tropics the surface water is warm and low density, and there is a pronounced thermocline separating it from the colder, denser deep water. As stated above, this stratification prevents nutrient-rich water from reaching the surface and as a result tropical regions often have low productivity. In the high latitudes the water is uniformly cold at all depths, so there is little density stratification. The lack of a pycnocline (or a thermocline) allows cold, nutrient-rich deep water to more easily mix with the surface water, leading to higher primary production in polar regions.
All of the salts and ions that dissolve in seawater contribute to its overall salinity. Salinity of seawater is usually expressed as the grams of salt per kilogram (1000 g) of seawater. On average, about 35 g of salt is present in each 1 kg of seawater, so we say that the average salinity of the ocean salinity is 35 parts per thousand (ppt). Note that 35 ppt is equivalent to 3.5% (parts per hundred). Some sources now use practical salinity units (PSU) to express salinity values, where 1 PSU = 1 ppt. The units are not included, so we can refer simply to a salinity of 35.
Many different substances are dissolved in the ocean, but six ions comprise about 99.4% of all the dissolved ions in seawater. These six major ions are (Table 5.3.1):
Table 5.3.1 The six major ions in seawater
| g/kg in seawater | % of ions by weight | |
|---|---|---|
| Chloride Cl- | 19.35 | 55.07% |
| Sodium Na+ | 10.76 | 30.6% |
| Sulfate SO42- | 2.71 | 7.72% |
| Magnesium Mg2+ | 1.29 | 3.68% |
| Calcium Ca2+ | 0.41 | 1.17% |
| Potassium K+ | 0.39 | 1.1% |
| 99.36% |
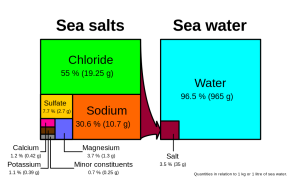
Chloride and sodium, the components of table salt (sodium chloride NaCl), make up over 85% of the ions in the ocean, which is why seawater tastes salty (Figure 5.3.1). In addition to the major constituents, there are numerous minor constituents; radionucleotides, organic compounds, metals etc. These minor constituents are found in concentrations of ppm (parts per million) or ppb (parts per billion), unlike the major ions that are far more abundant (ppt) (Table 5.3.2). To put this into perspective, 1 ppm = 1 mg/kg, or the equivalent of 1 teaspoon of sugar dissolved in 14,000 cans of soda. 1 ppb = 1 μg/kg, or the equivalent of 1 teaspoon of a substance dissolved in five Olympic-sized swimming pools! These minor constituents represent numerous substances, but together they make up less than 1% of the ions in the seawater. Some of these may be important as minerals and trace elements vital to living organisms, but they don’t have much impact on the overall salinity. But given the vast size of the oceans, even materials found in trace abundance can represent fairly large reservoirs. For example gold is a trace element in seawater, found in concentrations of parts per trillion, yet if you could extract all of the gold in just one km3 of seawater, it would be worth about $20 million!
Table 5.3.2 Concentrations of some minor elements in seawater
| g/kg in seawater | g/kg in seawater | ||
|---|---|---|---|
| Carbon | 0.028 | Iron | 2 x 10⁻⁶ |
| Nitrogen | 0.0115 | Manganese | 2 x 10⁻⁷ |
| Oxygen | 0.006 | Copper | 1 x 10⁻⁷ |
| Silicon | 0.002 | Mercury | 3 x 10⁻⁸ |
| Phosphorous | 6 x 10⁻⁵ | Gold | 4 x 10⁻⁹ |
| Uranium | 3.2 x 10⁻⁶ | Lead | 5 x 10⁻¹⁰ |
| Aluminum | 2 x 10⁻⁶ | Radon | 6 x 10-19 |
Because the six major ions in seawater comprise over 99% of the total salinity, changes in abundance of the minor constituents have little effect on overall salinity. Furthermore, the rule of constant proportions states that even though the absolute salinity of ocean water might differ in different places, the relative proportions of the six major ions within that water are always constant. For example, no matter the total salinity of a seawater sample, 55% of the total salinity will be due to chloride, 30% due to sodium, and so on. Since the proportion of these major ions does not change, we call these conservative ions.
Given these constant proportions, in order to calculate total salinity you can simply measure the concentration of just one of the major ions and use that value to calculate the rest. Traditionally chloride has been the ion measured because it is the most abundant, and thus the simplest to measure accurately. Multiplying the concentration of chloride by 1.8 gives the total salinity. For example, looking at Figure 5.3.1, 19.25 g/kg (ppt) chloride x 1.8 = 35 ppt. Today, for rapid measurements of salinity, electrical conductivity is often used rather than determining chloride concentrations (see box below).
Measuring salinity
There are a number of methods available for measuring the salinity of water. The most precise measurements utilize direct chemical analysis of the seawater in a lab setting, but there are a number of ways to get immediate salinity measurements in the field. For a quick estimate of salinity, a hand-held refractometer can be used (right).
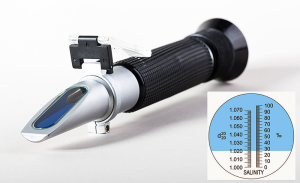
This instrument measures the degree of bending, or refraction, of light rays as they pass through a fluid. The greater the amount of dissolved salts in the sample, the greater the degree of light refraction. The observer traps a drop of water on the blue screen, and looks through the eyepiece. The dividing line between the blue and white sections of the scale (inset) can be used to read the salinity.
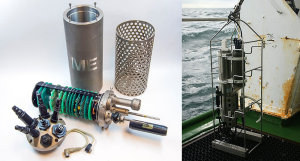
For more accurate measurements, most oceanographers use an instrument that measures electrical conductivity. An electrical current is passed between two electrodes immersed in water, and the higher the salinity, the more readily the current will be conducted (the ions in seawater conduct electrical currents). Conductivity probes are often bundled into an instrument called a CTD, which stands for Conductivity, Temperature, and Depth, which are the most commonly-measured parameters. Modern CTDs can be outfitted with an array of probes measuring parameters like light, turbidity (water clarity), dissolved gases etc. CTDs can be large instruments (below), but small hand-held salinity probes are also widely available.
For large-scale salinity measurements, oceanographers can use satellites, such as the Aquarius satellite, which was able to measure surface salinity differences as small as 0.2 PSU as it mapped the ocean surface every seven days (below).
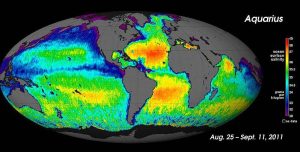
It is important to be aware that while the rule of constant proportions applies to most of the ocean, there may be certain coastal areas where lots of river discharge may alter these proportions slightly. Furthermore, it is important to remember that the rule of constant proportions only applies to the major ions. The proportions of the minor ions may fluctuate, but remember that they make a very minor contribution to overall salinity. Because the concentrations of the minor ions are not constant, these are referred to as non-conservative ions.
Why are the major ions found in constant proportions? There is constant input of ions from river runoff and other processes, usually in very different proportions from what is found in the ocean. So why don’t the proportions in the oceans change? Most of the ions discharged by rivers have fairly low residence times (see section 5.2) compared to ions in seawater, usually because they are used in biological processes. These low residence times do not allow the ions to accumulate and alter salinity. Also, the mixing time of the world ocean is around 1000 years, which is very short compared to the residence times of the major ions, which may be tens of millions of years long. So during the residence time of a single ion the ocean has mixed numerous times, and the major ions have become evenly distributed throughout the ocean.
Variations in Salinity
Total salinity in the open ocean averages 33-37 ppt, but it can vary significantly in different locations. But since the major ion proportions are constant, the regional salinity differences must be due more to water input and removal rather than the addition or removal of ions. Fresh water input comes through processes like precipitation, runoff from land, and melting ice. Fresh water removal primarily comes from evaporation and freezing (when seawater freezes, the resulting ice is mostly fresh water and the salts are excluded, making the remaining water even saltier). So differences in rates of precipitation, evaporation, river discharge, and ice formation play a significant role in regional salinity variations. For example, the Baltic Sea has a very low surface salinity of around 10 ppt, because it is a mostly enclosed body of water with lots of river input. Conversely, the Red Sea is very salty (around 40 ppt), due to the lack of precipitation and the hot environment which leads to high levels of evaporation.
One of the saltiest large bodies of water on Earth is the Dead Sea, between Israel and Jordan. Salinity in the Dead Sea is around 330 ppt, which is almost ten times saltier than the ocean. This extremely high salinity is a result of the hot, arid conditions in the Middle East that lead to high rates of evaporation. In addition, in the 1950s the flow from the Jordan River was diverted away from the Dead Sea, so there is no longer significant fresh water input. With no input and high evaporation, the water level in the Dead Sea is receding at a rate of about 1 m per year. The high salinity makes the water very dense, which creates buoyant forces that allow people to easily float at the surface. But the high salinity also means that the water is too salty for most living organisms, so only microbes are able to call it home; hence the name the Dead Sea. But as salty as the Dead Sea may be, it is not the saltiest body of water on Earth. That distinction currently belongs to Gaet’ale Pond in Ethiopia, with a salinity of 433 ppt!
Latitudinal Variations
While local conditions are important for determining salinity patterns in any single location, there are some global patterns that bear further investigation. Temperature is highest at the equator, and lowest near the poles, so we would expect higher rates of evaporation, and therefore higher salinity, in equatorial regions (Figure 5.3.2). This is generally the case, but in the figure below salinity right along the equator seems to be a little lower than at slightly higher latitudes. This is because equatorial regions also get a high volume of rain on a regular basis, which dilutes the surface water along the equator. So the higher salinities are found at subtropical, warm latitudes with high evaporation and less precipitation. At the poles there is little evaporation, which, coupled with ice and snow melting, produces a relatively low surface salinity. The image below shows high salinity in the Mediterranean Sea; this is located in a warm region with high evaporation, and the sea is largely isolated from mixing with the rest of the North Atlantic water, leading to high salinity. Lower salinities, such as those around southeast Asia, are the result of precipitation and high volumes of river input.
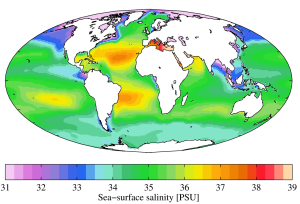
Figure 5.3.3 shows the mean global differences between evaporation and precipitation (evaporation - precipitation). Green colors represent areas where precipitation exceeds evaporation, while brown regions are where evaporation is greater than precipitations. Note the correlation between precipitation, evaporation, and surface salinity as seen in Figure 5.3.2.

Vertical Variation
In addition to geographical variation in salinity, there are also changes in salinity with depth. As we have seen, most differences in salinity are due to variations in evaporation, precipitation, runoff, and ice cover. All of these process occur at the ocean surface, not at depth, so the most pronounced differences in salinity should be found in surface waters. Salinity in deeper water remains relatively uniform, as it is unaffected by these surface processes. Some representative salinity profiles are shown in Figure 5.3.4. At the surface, the top 200 m or so show relatively uniform salinity in what is called the mixed layer. Winds, waves, and surface currents stir up the surface water, causing a great deal of mixing in this layer and fairly uniform salinity conditions. Below the mixed layer is an area of rapid salinity change over a small change in depth. This zone of rapid change is called the halocline, and it represents a transition between the mixed layer and the deep ocean. Below the halocline, salinity may show little variation down to the seafloor, as this region is far removed from the surface processes that impact salinity. In the figure below, note the low surface salinity at high latitudes, and higher surface salinity at low latitudes as discussed above. Yet despite the surface differences, salinity at depth in both locations may be very similar.

The most obvious feature of the oceans is that they contain water. Water is so ubiquitous that it may not seem like a very interesting substance, but it has many unique properties that impact global oceanographic and climatological processes. Many of these processes are due to hydrogen bonds forming between water molecules.
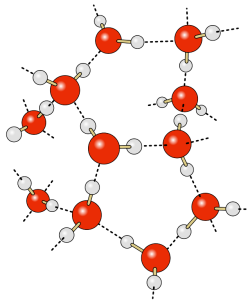
The water molecule consists of two hydrogen atoms and one oxygen atom. The electrons responsible for the bonds between the atoms are not distributed equally throughout the molecule, so that the hydrogen ends of water molecules have a slight positive charge, and the oxygen end has a slight negative charge, making water a polar molecule. The negative oxygen side of the molecule forms an attraction to the positive hydrogen end of a neighboring molecule. This rather weak force of attraction is called a hydrogen bond (Figure 5.1.1). If not for hydrogen bonds, water would vaporize at -68o C, meaning liquid water (and thus life) could not exist on Earth. These hydrogen bonds are responsible for some of water’s unique properties:
1. Water is the only substance to naturally exist in a solid, liquid, and gaseous form under the normal range of temperatures and pressures found on Earth. This is due to water’s relatively high freezing and vaporizing points (see below).
2. Water has a high heat capacity, which is the amount of heat that must be added to raise its temperature. Specific heat is the heat required to raise the temperature of 1 g of a substance by 1o C. Water has the highest specific heat of any liquid except ammonia (Table 5.1.1).
Table 5.1.1 Specific heat values for a number of common substances
| Specific Heat (calories/g/Co) | |
|---|---|
| Ammonia | 1.13 |
| Water | 1.00 |
| Acetone | 0.51 |
| Grain Alcohol | 0.23 |
| Aluminum | 0.22 |
| Copper | 0.09 |
| Silver | 0.06 |
Water is therefore one of the most difficult liquids to heat or cool; it can absorb large amounts of heat without increasing its temperature. Remember that temperature reflects the average kinetic energy of the molecules within a substance; the more vigorous the motion, the higher the temperature. In water, the molecules are held together by hydrogen bonds, and these bonds must be overcome to allow the molecules to move freely. When heat is added to water the energy must first go to breaking the hydrogen bonds before the temperature can begin to rise. Therefore, much of the added heat is absorbed by breaking H bonds, not by increasing the temperature, giving water a high heat capacity.
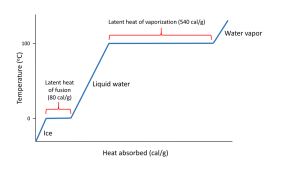
Hydrogen bonds also give water a high latent heat; the heat required to undergo a phase change from solid to liquid, or liquid to gas. The latent heat of fusion is the heat required to go from solid to liquid; 80 cal/g in the case of ice melting to water. Ice is a solid because hydrogen bonds hold the water molecules into a solid crystal lattice (see below). As ice is heated, the temperature rises up to 0o C. At that point, any additional heat goes to melting the ice by breaking the hydrogen bonds, not to increasing the temperature. So as long as ice is present, the water temperature will not increase. This is why your drink will remain cold as long as it contains ice; any heat absorbed goes to melting the ice, not to warming the drink.
When all of the ice is melted, additional heat will increase the temperature of the water 1o C for each calorie of heat added, until it reaches 100o C. At that point, any additional heat goes to overcoming the hydrogen bonds and turning the liquid water into water vapor, rather than increasing the water temperature. The heat required to evaporate liquid water into water vapor is the latent heat of vaporization which has a value of 540 cal/g (Figure 5.1.2).
The high heat capacity of water helps regulate global climate, as the oceans slowly absorb and release heat, preventing rapid swings in temperature (see section 8.1). It also means that aquatic organisms aren't as subjected to the same rapid temperature changes as terrestrial organisms. A deep ocean organism may not experience more than a 0.5o C change in temperature over its entire life, while a terrestrial species may encounter changes of more than 20o C in a single day!
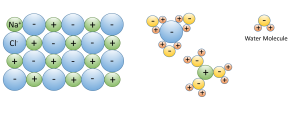
3. Water dissolves more substances than any other liquid; it is a "universal solvent", which is why so many substances are dissolved in the ocean. Water is especially good at dissolving ionic salts; molecules made from oppositely charged ions such as NaCl (Na+ and Cl-). In water, the charged ions attract the polar water molecules. The ions get surrounded by a layer of water molecules, weakening the bond between the ions by up to 80 times. With the bonds weakened between ions, the substance dissolves (Figure 5.1.3).
4. The solid phase is less dense than the liquid phase. In other words, ice floats. Most substances are denser in the solid form than in the liquid form, as their molecules are more closely packed together as a solid. Water is an exception: the density of fresh water is 1.0 g/cm3, while the density of ice is 0.92 g/cm3, and once again, this is due to the action of hydrogen bonds.
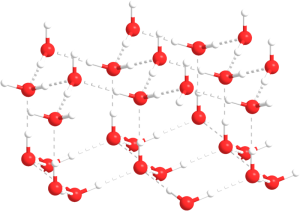
As water temperature cools the molecules slow down, eventually slowing enough that hydrogen bonds can form and hold the water molecules in a crystal lattice. The molecules in the lattice are spaced farther apart than the molecules in liquid water, which makes ice less dense than liquid water (Figure 5.1.4). This is familiar to anyone who has ever left a full water bottle in the freezer, only to have it burst as the water freezes and expands.
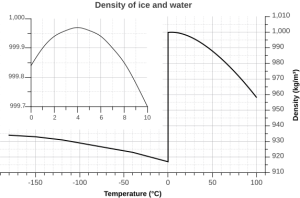
But the relationship between temperature and water density is not a simple linear one. As water cools, its density increases as expected, as the water molecules slow down and get closer together. However, fresh water reaches its maximum density at a temperature of 4o C, and as it cools beyond that point its density declines as the hydrogen bonds begin to form and the intermolecular spacing increases (Figure 5.1.5 inset). The density continues to decline until the temperature reaches 0o C and ice crystals form, reducing the density dramatically (Figure 5.1.5).
There are a number of important implications to ice being less dense than water. Ice floating on the surface of the ocean helps regulate ocean temperatures, and therefore global climate, by influencing the amount of sunlight that is reflected rather than absorbed (see section 5.6). On a smaller scale, surface ice can prevent lakes and ponds from freezing solid during the winter. As fresh surface water cools, the water gets denser, and sinks to the bottom. The new surface water then cools and sinks, and the process is repeated in what is referred to as overturning, with denser water sinking and less dense water moving to the surface only to be cooled and sink itself. In this way, the entire body of water is cooled somewhat evenly. This process continues until the surface water cools below 4o C. Below 4o C, the water becomes less dense as it cools, so it no longer sinks. Instead, it remains as the surface, getting colder and less dense, until it freezes at 0o C. Once fresh water freezes, the ice floats and insulates the rest of the water beneath it, reducing further cooling. The densest bottom water is still at 4o C, so it does not freeze, allowing the bottom of a lake or pond to remain unfrozen (which is good news for the animals living there) no matter how cold it gets outside.
The dissolved salts in seawater inhibit the formation of the crystal lattice, and therefore make it harder for ice to form. So seawater has a freezing point of about -2o C (depending on salinity), and freezes before a temperature of maximum density is reached. Thus seawater will continue to sink as it gets colder, until it finally freezes.
5. Water has a very high surface tension, the highest of any liquid except mercury (Table 5.1.2). Water molecules are attracted to each other by hydrogen bonds. For molecules not at the water surface, they are surrounded by other water molecules in all directions, so the attractive forces are evenly distributed in all directions. But for molecules at the surface there are few adjacent molecules above them, only below, so all of the attractive forces are directed inwards, away from the surface (Figure 5.1.6). This inwards force is what causes water droplets to take on a spherical shape, and water to bead up on a surface, as the spherical shape provides the minimum possible surface area. These attractive forces also cause the surface of the water to act like an elastic "skin" which allows things like insects to sit on the water's surface without sinking.

Table 5.1.2 Surface tensions of various liquids
| Liquid | Surface Tension (millinewton/meter) | Temperature oC |
|---|---|---|
| Mercury | 487.00 | 15 |
| Water | 71.97 | 25 |
| Glycerol | 63.00 | 20 |
| Acetone | 23.70 | 20 |
| Ethanol | 22.27 | 20 |
By Paul Webb, used under a CC-BY 4.0 international license. Download this book for free at https://rwu.pressbooks.pub/webboceanography/front-matter/preface/
Differential heating of the Earth's surface results in equatorial regions receiving more heat than the poles (section 6.1). As air is warmed at the equator it becomes less dense and rises, while at the poles the cold air is denser and sinks. If the Earth was non-rotating, the warm air rising at the equator would reach the upper atmosphere and begin moving horizontally towards the poles. As the air reached the poles it would cool and sink, and would move over the surface of Earth back towards the equator. This would result in one large atmospheric convection cell in each hemisphere (Figure 6.2.1), with air rising at the equator and sinking at the poles, and the movement of air over the Earth's surface creating the winds. On this non-rotating Earth, the prevailing winds would thus blow from the poles towards the equator in both hemispheres (Figure 6.2.1).
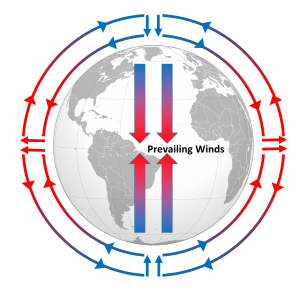
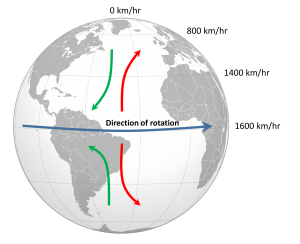
The non-rotating situation in Figure 6.2.1 is of course only hypothetical, and in reality the Earth's rotation makes this atmospheric circulation a bit more complex. The paths of the winds on a rotating Earth are deflected by the Coriolis Effect. The Coriolis Effect is a result of the fact that different latitudes on Earth rotate at different speeds. This is because every point on Earth must make a complete rotation in 24 hours, but some points must travel farther, and therefore faster, to complete the rotation in the same amount of time. In 24 hours a point on the equator must complete a rotation distance equal to the circumference of the Earth, which is about 40,000 km. A point right on the poles covers no distance in that time; it just turns in a circle. So the speed of rotation at the equator is about 1600 km/hr, while at the poles the speed is 0 km/hr. Latitudes in between rotate at intermediate speeds; approximately 1400 km/hr at 30o and 800 km/hr at 60o. As objects move over the surface of the Earth they encounter regions of varying speed, which causes their path to be deflected by the Coriolis Effect.
To explain the Coriolis Effect, imagine a cannon positioned at the equator and facing north. Even though the cannon appears stationary to someone on Earth, it is in fact moving east at about 1600 km/hr due to Earth's rotation. When the cannon fires the projectile travels north towards its target; but it also continues to move to the east at 1600 km/hr, the speed it had while it was still in the cannon. As the shell moves over higher latitudes, its momentum carries it eastward faster than the speed at which the ground beneath it is rotating. For example, by 30o latitude the shell is moving east at 1600 km/hr while the ground is moving east at only 1400 km/hr. Therefore, the shell gets "ahead" of its target, and will land to the east of its intended destination. From the point of view of the cannon, the path of the projectile appears to have been deflected to the right (red arrow, Figure 6.2.2). Similarly, a cannon located at 60o and facing the equator will be moving east at 800 km/hr. When its shell is fired towards the equator, the shell will be moving east at 800 km/hr, but as it approaches the equator it will be moving over land that is traveling east faster than the projectile. So the projectile gets "behind" its target, and will land to the west of its destination. But from the point of view of the cannon facing the equator, the path of the shell still appears to have been deflected to the right (green arrow, Figure 6.2.2). Therefore, in the Northern Hemisphere, the apparent Coriolis deflection will always be to the right.
In the Southern Hemisphere the situation is reversed (Figure 6.2.2). Objects moving towards the equator from the south pole are moving from low speed to high speed, so are left behind and their path is deflected to the left. Movement from the equator towards the south pole also leads to deflection to the left. In the Southern Hemisphere, the Coriolis deflection is always to the left from the point of origin.
The magnitude of the Coriolis deflection is related to the difference in rotation speed between the start and end points. Between the poles and 60o latitude, the difference in rotation speed is 800 km/hr. Between the equator and 30o latitude, the difference is only 200 km/hr (Figure 6.2.2). Therefore the strength of the Coriolis Effect is stronger near the poles, and weaker at the equator.
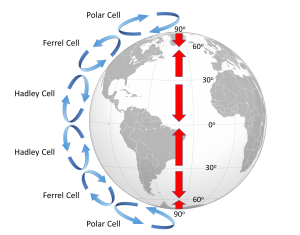
Because of the rotation of the Earth and the Coriolis Effect, rather than a single atmospheric convection cell in each hemisphere, there are three major cells per hemisphere. Warm air rising at the equator cools as it moves through the upper atmosphere, and it descends at around 30o latitude. The convection cells created by rising air at the equator and sinking air at 30o are referred to as Hadley Cells, of which there is one in each hemisphere. The cold air that descends at the poles moves over the Earth's surface towards the equator, and by about 60o latitude it begins to rise, creating a Polar Cell between 60o and 90o. Between 30o and 60o lie the Ferrel Cells, composed of sinking air at 30o and rising air at 60o (Figure 6.2.3). With three convection cells in each hemisphere that rotate in alternate directions, the surface winds no longer always blow from the poles towards the equator as in the non-rotating Earth in Figure 6.2.1. Instead, surface winds in both hemispheres blow towards the equator between 90o and 60o latitude, and between 0o and 30o latitude. Between 30o and 60o latitude, the surface winds blow towards the poles (Figure 6.2.3).
The surface winds created by the atmospheric convection cells are also influenced by the Coriolis Effect as they change latitudes. The Coriolis Effect deflects the path of the winds to the right in the Northern Hemisphere and to the left in the Southern Hemisphere. Adding this deflection leads to the pattern of prevailing winds illustrated in Figure 6.2.4. Between the equator and 30o latitude are the trade winds; the northeast trade winds in the Northern Hemisphere and the southeast trade winds in the Southern Hemisphere (note that winds are named based on the direction from which they originate, not where they are going). The westerlies are the dominant winds between 30o and 60o in both hemispheres, and the polar easterlies are found between 60o and the poles.
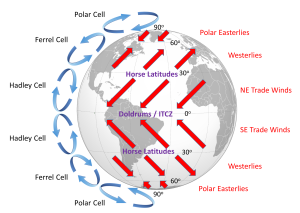
In between these wind bands lie regions of high and low pressure. High pressure zones occur where air is descending, while low pressure zones indicate rising air. Along the equator the rising air creates a low pressure region called the doldrums, or the Intertropical Convergence Zone (ITCZ)(convergence zone because this is where the trade winds converge). At 30o latitude there are high pressure zones of descending air known as the horse latitudes, or the subtropical highs. Finally, at 60o lies another low pressure region called the polar front. It should be noted that these high and low pressure zones are not fixed in place; their latitude fluctuates depending on the season, and these fluctuations have important implications for regional climates.
Doldrums? Horse latitudes? Trade winds?
These may seem like some odd names for these atmospheric phenomena, but many of them can be traced back to maritime traditions and lore.
The doldrums refer to regions of low pressure around the equator. In these areas, air is rising rather than moving horizontally, so these regions commonly encounter very light winds. The lack of wind could leave sailing ships becalmed for days or weeks at a time, which was not good for the morale of the ship's crew.
Like the doldrums the horse latitudes are also areas with light winds, this time due to descending air, which could leave ships becalmed. One explanation for the term "horse latitudes" is that when these ships became stranded they ran the risk of running out of food or water. To conserve these resources, sailors would throw their dead or dying horses overboard, hence the "horse latitudes." Another explanation is that many sailors received part of their pay before a voyage, and often spent it before departing. This meant that they would spend the first part of the voyage working without pay and in debt, a period called the "dead horse" time, which might last for a few months. When they started earning their pay once again, they had a "dead horse" ceremony and threw a pretend horse overboard. The timing of this ceremony often coincided with reaching the horse latitudes, leading to the association of the ceremony with the location. A third explanation is that a ship was referred to as "horsed" when winds were weak and the ship instead had to rely on ocean currents to move them. This could be a common occurrence in the high pressure zones around 30o latitude, so they were referred to as the horse latitudes.
The term trade winds may have originally derived from the terms for "track" or "path", but the term may have become more common during European exploration and commercialization of the New World. Mariners sailing from Europe to the New World could sail south until they reached the trade winds, which would then propel their ships across the Atlantic to the Caribbean. To return to Europe, ships could sail to the northeast until they entered the westerlies, which would then steer them back to Europe.

