36 5.5 Dissolved Gases: Carbon Dioxide, pH, and Ocean Acidification
Oxygen and carbon dioxide are involved in the same biological processes in the ocean, but in opposite ways; photosynthesis consumes CO2 and produces O2, while respiration and decomposition consume O2 and produce CO2. Therefore it should not be surprising that oceanic CO2 profiles are essentially the opposite of dissolved oxygen profiles (Figure 5.5.1). At the surface, photosynthesis consumes CO2 so CO2 levels remain relatively low. In addition, organisms that utilize carbonate in their shells are common near the surface, further reducing the amount of dissolved CO2.
In deeper water, CO2 concentration increases as respiration exceeds photosynthesis, and decomposition of organic matter adds additional CO2 to the water. As with oxygen, there is often more CO2 at depth because cold bottom water holds more dissolved gases, and high pressures increase solubility. Deep water in the Pacific contains more CO2 than the Atlantic as the Pacific water is older and has accumulated more CO2 from the respiration of benthic organisms.
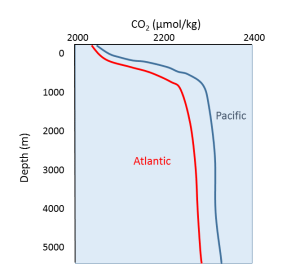
But the behavior of carbon dioxide in the ocean is more complex than the figure above would suggest. When CO2 gas dissolves in the ocean, it interacts with the water to produce a number of different compounds according to the reaction below:
CO2 + H2O ↔ H2CO3 ↔ H+ + HCO3– ↔ 2H+ + CO32-
CO2 reacts with water to produce carbonic acid (H2CO3), which then dissociates into bicarbonate (HCO3–) and hydrogen ions (H+). The bicarbonate ions can further dissociate into carbonate (CO32-) and additional hydrogen ions (Figure 5.5.2).
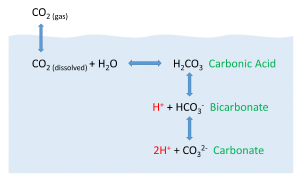
Most of the CO2 dissolving or produced in the ocean is quickly converted to bicarbonate. Bicarbonate accounts for about 92% of the CO2 dissolved in the ocean, and carbonate represents around 7%, so only about 1% remains as CO2, and little gets absorbed back into the air. The rapid conversion of CO2 into other forms prevents it from reaching equilibrium with the atmosphere, and in this way, water can hold 50-60 times as much CO2 and its derivatives as the air.
CO2 and pH
The equation above also illustrates carbon dioxide’s role as a buffer, regulating the pH of the ocean. Recall that pH reflects the acidity or basicity of a solution. The pH scale runs from 0-14, with 0 indicating a very strong acid, and 14 representing highly basic conditions. A solution with a pH of 7 is considered neutral, as is the case for pure water. The pH value is calculated as the negative logarithm of the hydrogen ion concentration according to the equation:
pH = -log10[H+]
Therefore, a high concentration of H+ ions leads to a low pH and acidic condition, while a low H+ concentration indicates a high pH and basic conditions. It should also be noted that pH is described on a logarithmic scale, so every one point change on the pH scale actually represents an order of magnitude (10 x) change in solution strength. So a pH of 6 is 10 times more acidic than a pH of 7, and a pH of 5 is 100 times (10 x 10) more acidic than a pH of 7.
Carbon dioxide and the other carbon compounds listed above play an important role in buffering the pH of the ocean. Currently, the average pH for the global ocean is about 8.1, meaning seawater is slightly basic. Because most of the inorganic carbon dissolved in the ocean exists in the form of bicarbonate, bicarbonate can respond to disturbances in pH by releasing or incorporating hydrogen ions into the various carbon compounds. If pH rises (low [H+]), bicarbonate may dissociate into carbonate, and release more H+ ions, thus lowering pH. Conversely, if pH gets too low (high [H+]), bicarbonate and carbonate may incorporate some of those H+ ions and produce bicarbonate, carbonic acid, or CO2 to remove H+ ions and raise the pH. By shuttling H+ ions back and forth between the various compounds in this equation, the pH of the ocean is regulated and conditions remain favorable for life.
CO2 and Ocean Acidification
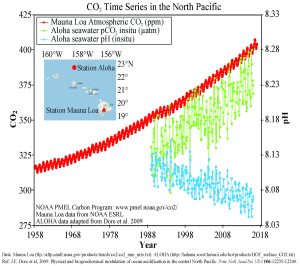
In recent years there has been rising concern about the phenomenon of ocean acidification. As described in the processes above, the addition of CO2 to seawater lowers the pH of the water. As anthropogenic sources of atmospheric CO2 have increased since the Industrial Revolution, the oceans have been absorbing an increasing amount of CO2, and researchers have documented a decline in ocean pH from about 8.2 to 8.1 in the last century. This may not appear to be much of a change, but remember that since pH is on a logarithmic scale, this decline represents a 30% increase in acidity. It should be noted that even at a pH of 8.1 the ocean is not actually acidic; the term “acidification” refers to the fact that the pH is becoming lower, i.e. the water is moving towards more acidic conditions.
Figure 5.5.3 presents data from observation stations in and around the Hawaiian Islands. As atmospheric levels of CO2 have increased, the CO2 content of the ocean water has also increased, leading to a reduction in seawater pH. Some models suggest that at the current rate of CO2 addition to the atmosphere, by 2100 ocean pH may be further reduced to around 7.8, which would represent more than a 120% increase in ocean acidity since the Industrial Revolution.
Why is this important? Declining pH can impact many biological systems. Of particular concern are organisms that secrete calcium carbonate shells or skeletons, such as corals, shellfish, and may planktonic organisms. At lower pH levels, calcium carbonate dissolves, eroding the shells and skeletons of these organisms (Figure 5.5.4).

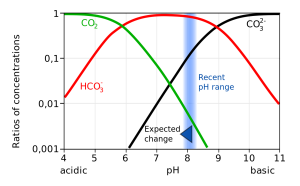
Not only does a declining pH lead to increased rates of dissolution of calcium carbonate, it also diminishes the amount of free carbonate ions in the water. The relative proportions of the different carbon compounds in seawater is dependent on pH (Figure 5.5.6). As pH declines, the amount of carbonate declines, so there is less available for organisms to incorporate into their shells and skeletons. So ocean acidification both dissolves existing shells and makes it harder for shell formation to occur.
Additional links for more information:
- NOAA Ocean Acidification Program website http://oceanacidification.noaa.gov/
Estuaries are partially enclosed bodies of water where the salt water is diluted by fresh water input from land, creating brackish water with a salinity somewhere between fresh water and normal seawater. Estuaries include many bays, inlets, and sounds, and are often subject to large temperature and salinity variations due to their enclosed nature and smaller size compared to the open ocean.
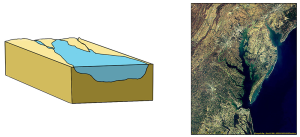
Estuaries can be classified geologically into four basic categories based on their method of origin. In all cases they are a result of rising sea level over the last 18,000 years, beginning with the end of the last ice age; a period that has seen a rise of about 130 m. The rise in sea level has flooded coastal areas that were previously above water, and prevented the estuaries from being filled in by all of the sediments that have been emptied into them.
The first type is a coastal plain estuary, or drowned river valley. These estuaries are formed as sea level rises and floods an existing river valley, mixing salt and fresh water to create the brackish conditions where the river meets the sea. These types of estuaries are common along the east coast of the United States, including major bodies such as the Chesapeake Bay, Delaware Bay, and Narragansett Bay (Figure 4.6.1). Coastal plain estuaries are usually shallow, and since there is a lot of sediment input from the rivers, there are often a number of depositional features associated with them such as spits and barrier islands.
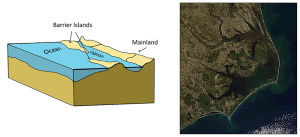
The presence of sand bars, spits, and barrier islands can lead to bar-built estuaries, where a barrier is created between the mainland and the ocean. The water that remains inside the sand bar is cut off from complete mixing with the ocean, and receives freshwater input from the mainland, creating estuarine conditions (Figure 4.6.2).
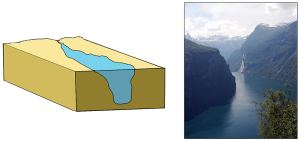
Fjords are estuaries formed in deep, U-shaped basins that were carved out by advancing glaciers. When the glaciers melted and retreated, sea level rose and filled these troughs, creating deep, steep-walled fjords (Figure 4.6.3). Fjords are common in Norway, Alaska, Canada, and New Zealand, where there are mountainous coastlines once covered by glaciers.
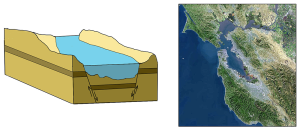
Tectonic estuaries are the result of tectonic movements, where faulting causes some sections of the crust to subside, and those lower elevation sections then get flooded with seawater. San Francisco Bay is an example of a tectonic estuary (Figure 4.6.4).
Estuaries are also classified based on their salinity and mixing patterns. The amount of mixing of fresh and salt water in an estuary depends on the rate at which fresh water enters the head of the estuary from river input, and the amount of seawater that enters the estuary mouth as a result of tidal movements. The input of fresh water is reflected in the flushing time of the estuary. This refers to the time it would take for the in-flowing fresh water to completely replace all the fresh water currently in the estuary. Seawater input is measured by the tidal volume, or tidal prism, which is the average volume of sea water entering and leaving the estuary during each tidal cycle. In other words, it is the volume difference between high and low tides. The interaction between the flushing time, tidal volume, and the shape of the estuary will determine the extent and type of water mixing within the estuary.
In a vertically mixed, or well-mixed estuary there is complete mixing of fresh and salt water from the surface to the bottom. In a particular location the salinity is constant at all depths, but across the estuary the salinity is lowest at the head where the fresh water enters, and is highest at the mouth, where the seawater comes in. This type of salinity profile usually occurs in shallower estuaries, where the shallow depths allow complete mixing from the surface to the bottom.
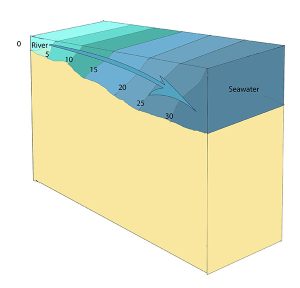
Slightly stratified or partially mixed estuaries have similar salinity profiles to vertically mixed estuaries, where salinity increases from the head to the mouth, but there is also a slight increase in salinity with depth at any point. This usually occurs in deeper estuaries than those that are well-mixed, where waves and currents mix the surface water, but the mixing may not extend all the way to the bottom.
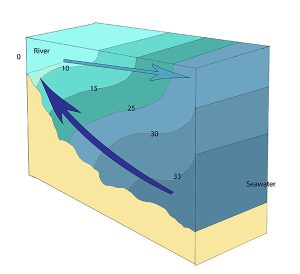
A salt wedge estuary occurs where the outflow of fresh water is strong enough to prevent the denser ocean water to enter through the surface, and where the estuary is deep enough that surface waves and turbulence have little mixing effect on the deeper water. Fresh water flows out along surface, salt water flows in at depth, creating a wedge shaped lens of seawater moving along the bottom. The surface water may remain mostly fresh throughout the estuary if there is no mixing, or it can become brackish depending on the level of mixing that occurs.

Highly stratified profiles are found in very deep estuaries, such as in fjords. Because of the depth, mixing of fresh and salt water only occurs near the surface, so in the upper layers salinity increases from the head to the mouth, but the deeper water is of standard ocean salinity.

Estuaries are very important commercially, as they are home to the majority of the world’s metropolitan areas, they serve as ports for industrial activity, and a large percentage of the world's population lives near estuaries. Estuaries are also very important biologically, especially in their role as the breeding grounds for many species of fish, birds, and invertebrates.
By Paul Webb, used under a CC-BY 4.0 international license. Download this book for free at https://rwu.pressbooks.pub/webboceanography/front-matter/preface/
Although Alfred Wegener would not live to see it, his theory of plate tectonics would gradually gain acceptance within the scientific community as more evidence began to accumulate. Some of the most important evidence came from the study of paleomagnetism, or changes in Earth's magnetic field over millions of years.
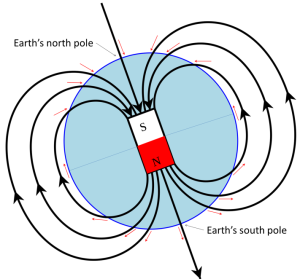
Earth’s magnetic field is defined by the North and South Poles that align generally with the axis of rotation (Figure 2.2.1). The lines of magnetic force flow into Earth in the Northern Hemisphere and out of Earth in the Southern Hemisphere. Because of the shape of the field lines, the magnetic force trends at different angles to the surface in different locations (red arrows of Figure 2.2.1). At the North and South Poles, the force is vertical. Anywhere on the equator the force is horizontal, and everywhere in between, the magnetic force is at some intermediate angle to the surface.
In its fluid form, the minerals that make up magma are free to move in any direction and take on any orientation. But as the magma cools and solidifies, movement ceases and the mineral orientation and position become fixed. As the mineral magnetite (Fe3O4) crystallizes from magma, it becomes magnetized with an orientation parallel to that of Earth’s magnetic field at that time, similar to the way a compass needle aligns with the magnetic field to point north. This magnetic record in the rock is called remnant magnetism. Rocks like basalt, which cool from a high temperature and commonly have relatively high levels of magnetite, are particularly susceptible to being magnetized in this way, but even sediments and sedimentary rocks, as long as they have small amounts of magnetite, will take on remnant magnetism because the magnetite grains gradually become reoriented following deposition. By studying both the horizontal and vertical components of the remnant magnetism, one can tell not only the direction to magnetic north at the time of the rock’s formation, but also the latitude where the rock formed relative to magnetic north.
In the early 1950s, a group of geologists from Cambridge University, including Keith Runcorn, Edward Irving and several others, started looking at the remnant magnetism of Phanerozoic British and European volcanic rocks, and collecting paleomagnetic data. They found that rocks of different ages sampled from generally the same area showed quite different apparent magnetic pole positions (green line, Figure 2.2.2). They initially assumed that this meant that Earth’s magnetic field had, over time, departed significantly from its present position, which is close to the rotational pole.

The curve defined by the paleomagnetic data was called a polar wandering path because Runcorn and his colleagues initially thought that their data represented actual movement of the magnetic poles (since geophysical models of the time suggested that the magnetic poles did not need to be aligned with the rotational poles). We now know that the magnetic data define movement of continents, and not of the magnetic poles, so we call it an apparent polar wandering path (APWP). Runcorn and colleagues soon extended their work to North America, and this also showed apparent polar wandering, but the results were not consistent with those from Europe (Figure 2.2.2). For example, the 200 Ma pole for North America placed somewhere in China, while the 200 Ma pole for Europe placed in the Pacific Ocean. Since there could only have been one pole position at 200 Ma, this evidence strongly supported the idea that North America and Europe had moved relative to each other since 200 Ma. Subsequent paleomagnetic work showed that South America, Africa, India, and Australia also have unique polar wandering curves. Rearranging the continents based on their positions in Pangaea caused these wandering curves to overlap, showing that the continents had moved over time.
Additional evidence for movement of the continents came from analysis of magnetic dip. Recall from Figure 2.2.1 that the angle of the magnetic field changes as a function of latitude, with the field directed vertically downwards at the north pole, upwards at the south pole, and horizontal at the equator. Every latitude between the equator and the poles will have a corresponding angle between horizontal and vertical (red arrows, Figure 2.2.1). By looking at the dip angle in rocks, we can determine the latitude at which those rocks were formed. Combining that with the age of the rocks, we can trace the movements of the continents over time. For example, at around 500 Ma, what we now call Europe was south of the equator, and so European rocks formed then would have acquired an upward-pointing magnetic field orientation (Figure 2.2.3). Between then and now, Europe gradually moved north, and the rocks forming at various times acquired steeper and steeper downward-pointing magnetic orientations.

The continued erosion and deposition of coastal sediments is a natural process, with features forming and disappearing as sea level and other conditions change. However, we have also come to enjoy and rely on many of these beaches and other coastal features for commerce, recreation, and living space. So from our perspective, we often see the transient nature of the coast as a threat to our activities, and as a result we have developed a number of ways to try and influence the erosion process, usually through hard stabilization, or the building of structures to stop the flow of sand. While some of these efforts have been successful, many others have actually exacerbated the problem, as we will see below.
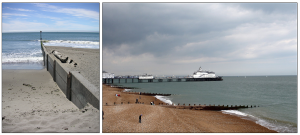
Groins (or groynes) are barriers built perpendicular to the shore (Figure 4.5.1 left). Groins are built to interrupt longshore transport and trap sand upstream of the groin, which they do very well. But downstream of the groin the source of replacement sand is cut off, while sand continues to be removed, so erosion can become even more pronounced on that side of the groin. To prevent that erosion, another groin must be built downstream of the first one, which then creates its own erosion problems, leading to another groin, and so on. Eventually a beach may become covered in a series of groins, called a groin field, all trying to stabilize the natural flow of sand (Figure 4.5.1 right).
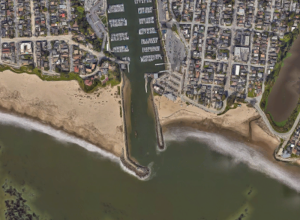
Jetties are like longer groins, often built to protect the mouths of harbors to prevent them from filling with sand. Because they are longer they can trap more sand than groins, and they also can contribute to increased erosion on the downstream side (Figure 4.5.2). If too much sand accumulates upstream of the jetty it can spread past the jetty and into the mouth of the harbor, in which case the jetty may need to be extended.
Breakwaters are walls that are usually built parallel to the shore. Their purpose is not necessarily to interfere with sediment transport, but instead to protect the areas behind them from heavy wave action, so they are often deployed at the mouth of a harbor, or to protect the boats in a mooring field. But breakwaters do have an unintended impact on sediment distribution. Longshore transport continues to move sand along the beach, but once it gets behind the breakwater the lack of wave action interrupts the flow, and the sand settles and accumulates. The beach grows behind a breakwater, until eventually they may become connected (Figure 4.5.3). With the longshore transport interrupted, increased erosion can occur downstream of the breakwater.

Santa Monica Pier
The beach around the Santa Monica Pier in California provides a good example of the effects of breakwaters on a sandy shore. A breakwater was constructed in the early 1930s to protect the pier and the boats that moored near it. Following the construction, the once-straight beach became much wider behind the breakwater as sand accumulated in the absence of strong wave action (below left). Now that the breakwater is no longer in place, the bulge in the shoreline is gone, and the beach is much straighter once again (below right).
 Left; aerial image of Santa Monica Pier and breakwater from 1936 (Courtesy of Santa Monica Public Library Image Archives/ Spence Air Photos). Right; Santa Monica Pier in 2011 (© JCS, CC BY-SA 3.0, via Wikimedia Commons).
Seawalls are constructed at the top of the surf zone, where the waves crash against the shore. The walls are designed as a barrier between the waves and the shore, to prevent the land from being eroded (Figure 4.5.4). They are often utilized in beachfront property to prevent the ground under a home from being undermined by the waves. However, as with the other forms of hard stabilization we have discussed, seawalls are not without their own environmental consequences. The sudden release of wave energy on a seawall can create turbulence, which undermines the sediment at the base of the wall and causes it to erode. Furthermore, on a softer, natural coastline some of the wave energy is absorbed or dissipated, but with a hard seawall most of the wave energy is reflected, leading to stronger longshore currents and faster erosion. In many places where seawalls have been built the beaches are getting steeper, and erosion rates have increased, with the potential for seawalls to collapse along with whatever they are supporting. Because of this, some coastal communities are phasing out seawall construction to try to return to more natural beach fronts.

By Paul Webb, used under a CC-BY 4.0 international license. Download this book for free at https://rwu.pressbooks.pub/webboceanography/front-matter/preface/
Continental margins refer to the region of transition from the land to the deep seafloor, i.e. between continental and oceanic crust. In an active continental margin, the boundary between the continent and the ocean is also a tectonic plate boundary, so there is a lot of geological activity around the margin. The west coast of the United States is an example of an active margin, where the coastline corresponds with the boundary between the Pacific and North America Plates. A passive continental margin occurs where the transition from land to sea is not associated with a plate boundary. The east coast of the United States is a good example; the plate boundary is located along the mid Atlantic ridge, far from the coast. Passive margins are less geologically active. Figure 1.2.1 shows an idealized passive margin. When examining this figure, and others like it, note that there is significant vertical exaggeration; the depth scale covers approximately 5000 m, while the horizontal scale extends around 300 km. This makes the features look much steeper than they actually are. The bar at the bottom of Figure 1.2.1 shows what a passive margin would look like without this exaggeration; there is a much more gradual transition to depth.
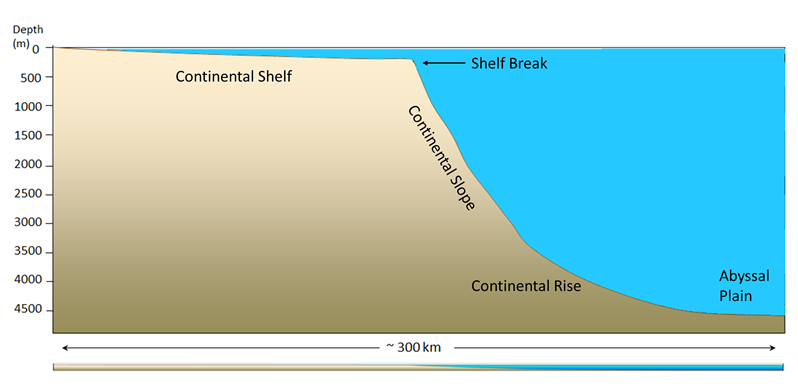
The continental shelf is the shallow, flooded edge of the continent. Geologically the shelf is still part of the continental crust, but it is often overlaid with marine sediments. On average, the shelf extends about 80 km from the coast; some margins have very little shelf, while the Siberian Shelf in the Arctic extends roughly 1500 km. The depth of the shelf generally remains below about 150 m, and the floor of the shelf is fairly flat. The flat topography is the result of changes in sea level; throughout history the shelves have been both submerged and exposed, and as sea level rose and fell, wave action, ice sheets, and other erosional processes smoothed out the shelf surface. Wave action and the movement of sediments over the shelf have continued this smoothing process. Continental shelves only make up about 6% of the ocean's surface area, but they are biologically one of the richest parts of the ocean; their shallow depth prevents nutrients from sinking out, and their proximity to the coast provides significant nutrient input. The continental shelf ends at the shelf break, which is the point where the angle of the seafloor begins to get steeper. The shelf break averages about 135 m deep.
After the shelf break, the seafloor takes on a steeper angle (about 4o) as it descends to the deep ocean. This steeper portion of the margin is the continental slope, and it extends from the shelf break down to 3000-5000m. In some parts of the ocean, large submarine canyons have been carved into the continental slope; for example, Monterey Canyon in Monterey Bay, California, is a submarine canyon similar in size to the Grand Canyon! These canyons may be carved out by turbidity currents, which are essentially landslides of sediment, rocks, and other debris down the face of the slope.
At the bottom of the slope is the continental rise. This area represents where the continental crust meets the oceanic crust, as the slope begins to level off to become the deep ocean floor. The rise consists of a thick layer of accumulated sediment coming from the continent, so it is difficult to tell where the slope ends and the rise begins.
After the rise comes the abyssal plain, or the deep ocean floor, lying between 4500 - 6000 m. The abyssal plain includes most of the ocean floor, and is the flattest region on Earth. It is flat due to millions of years of sediment accumulation on the bottom, which buries many bottom features (Figure 1.2.2).

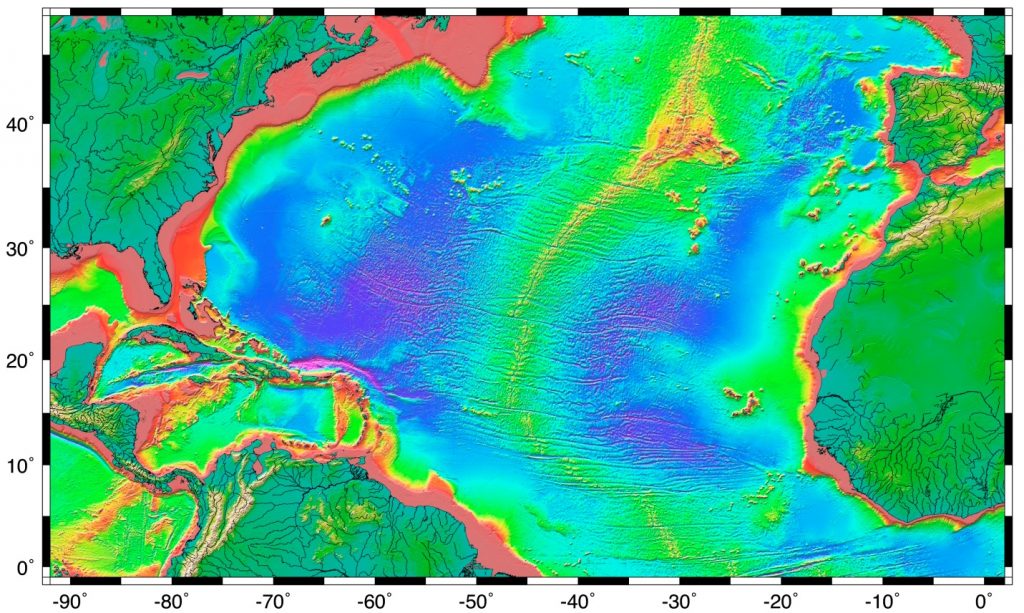
Passive margins, as described above, have wide shelves, gentle slopes, and a well-developed rise. Since passive margins are not plate boundaries, they experience long periods of relative stability which can lead to the development of these features. Active margins have similar features to passive margins, but the plate boundary affects the properties of the features. Active margins, like the Pacific coast of North America, have narrower shelves, steeper slopes, and little to no rise, particularly in convergent boundaries. Trenches associated with subduction zones act as sediment traps, preventing the accumulation of a continental rise, and keeping sediments off of the abyssal plains.

