35 5.4 Dissolved Gases: Oxygen
Ions are not the only materials that are dissolved in seawater. The oceans also contain dissolved gases that are very important to living organisms, particularly oxygen (O2), carbon dioxide (CO2), and nitrogen (N2). Oxygen is required for respiration in marine plants, algae, and phytoplankton (the primary producers) and animals. Carbon dioxide is utilized by the primary producers to power photosynthesis, a byproduct of which is oxygen. Nitrogen gas dissolved in the ocean is fixed by bacteria and converted into the forms required for primary production, such as nitrate and nitrite.
All of these gases are found in the atmosphere, and can enter the ocean by dissolving into the water at the ocean’s surface. But the amount of each gas in air is very different from the amount found in the ocean (Table 5.4.1).
Table 5.4.1 Percentage of total gas in each compartment
| Air | Total Ocean | Surface Ocean | |
|---|---|---|---|
| N2 | 78% | 11% | 48% |
| O2 | 21% | 6% | 36% |
| CO2 | 0.04% | 83% | 15% |
The amount of each gas that can dissolve in the ocean depends on the solubility and saturation of the gas in water. Solubility refers to the amount of a dissolved gas that the water can hold under a particular set of conditions, which are usually defined as 0o C and 1 atmosphere of pressure. The solubility of a gas increases with increasing pressure, decreased temperature, and decreased salinity. Saturation refers to the amount of gas currently dissolved in the water, relative to the maximum possible content. If the water is undersaturated, more gas can dissolve. If the water is saturated or supersaturated, gas may be released. Most atmospheric gases are saturated in the ocean, but O2 and CO2 are not saturated because they are rapidly used by living organisms.
Oxygen
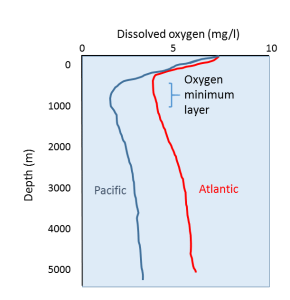
Typical oceanic dissolved oxygen profiles are shown in Figure 5.4.1. The shape of the profile is determined by the various processes that add or remove oxygen from the water at different depths.
Oxygen content is highest at the surface for two main reasons; this is where oxygen dissolves into the ocean from the atmosphere, and the surface water is where oxygen is produced by phytoplankton through photosynthesis. Respiration is also occurring in the surface waters, but the rate of photosynthetic oxygen production is greater than the rate of removal through respiration. It should be noted that even though dissolved oxygen is highest at the surface, there is still far less oxygen in the water than is found in the air. Well-oxygenated surface water may only contain around 8 mg O2/l, while the air contains 210 mg O2/l.
As depth increases, dissolved oxygen declines, reaching a minimum between a few hundred meters and 1000 m deep, the aptly-named oxygen minimum layer. At these depths and below, the water is too far removed from the surface for any atmospheric exchange, and there is not enough light to support photosynthesis, so there is little if any oxygen added to the water. At the same time, oxygen is removed from the water through the respiration of deep water organisms, and the decomposition of organic material by bacteria as it sinks to depth.
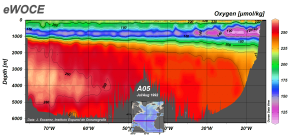
Below the oxygen minimum layer there is often an increase in dissolved oxygen at the greatest depths (Figures 5.4.1, 5.4.2). This bottom water is usually colder than the surface water and is under enormous pressure; as stated above, lower temperatures and higher pressure increase the solubility of dissolved gases. But there is another reason that bottom water contains more oxygen than mid-water depths that has to do with the way water circulates throughout the deep ocean (see section 7.8). In polar regions, the cold surface water absorbs lots of oxygen. This cold, oxygen-rich water sinks to the bottom due to its high density, taking the oxygen with it. The oxygen-rich bottom water will then spend the next thousand years or so moving over the seafloor throughout the major ocean basins. This deep water circulation is the source of oxygen for bottom-dwelling (benthic) organisms. The oxygen-rich bottom water forms in the polar regions of the Atlantic, and slowly makes its way to the Pacific, with oxygen being removed for respiration along the way. This is why dissolved oxygen levels in Pacific deep water are generally lower than in the Atlantic (Figure 5.4.1).
Areas where dissolved oxygen levels are too low to support most life are referred to as hypoxic zones (they are experiencing hypoxia, or low oxygen). Hypoxia is usually defined as oxygen levels below 2 mg/L. Anoxic zones (anoxia = without oxygen) show more severe forms of hypoxia, with oxygen below 0.5 mg/L. Some parts of the oceans may experience seasonal or temporary periods of hypoxia, while in other areas these conditions may last much longer. These hypoxic conditions often lead to mass die-offs of marine organisms who struggle to survive without sufficient oxygen.
Additional links for more information:
- NOAA site on oceanic hypoxic zones: http://oceanservice.noaa.gov/hazards/hypoxia/
Estuaries are partially enclosed bodies of water where the salt water is diluted by fresh water input from land, creating brackish water with a salinity somewhere between fresh water and normal seawater. Estuaries include many bays, inlets, and sounds, and are often subject to large temperature and salinity variations due to their enclosed nature and smaller size compared to the open ocean.
Estuaries can be classified geologically into four basic categories based on their method of origin. In all cases they are a result of rising sea level over the last 18,000 years, beginning with the end of the last ice age; a period that has seen a rise of about 130 m. The rise in sea level has flooded coastal areas that were previously above water, and prevented the estuaries from being filled in by all of the sediments that have been emptied into them.
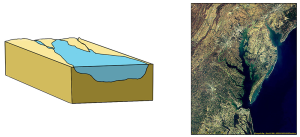
The first type is a coastal plain estuary, or drowned river valley. These estuaries are formed as sea level rises and floods an existing river valley, mixing salt and fresh water to create the brackish conditions where the river meets the sea. These types of estuaries are common along the east coast of the United States, including major bodies such as the Chesapeake Bay, Delaware Bay, and Narragansett Bay (Figure 4.6.1). Coastal plain estuaries are usually shallow, and since there is a lot of sediment input from the rivers, there are often a number of depositional features associated with them such as spits and barrier islands.
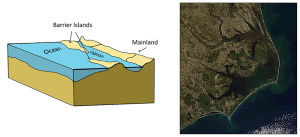
The presence of sand bars, spits, and barrier islands can lead to bar-built estuaries, where a barrier is created between the mainland and the ocean. The water that remains inside the sand bar is cut off from complete mixing with the ocean, and receives freshwater input from the mainland, creating estuarine conditions (Figure 4.6.2).
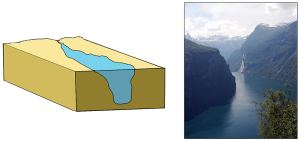
Fjords are estuaries formed in deep, U-shaped basins that were carved out by advancing glaciers. When the glaciers melted and retreated, sea level rose and filled these troughs, creating deep, steep-walled fjords (Figure 4.6.3). Fjords are common in Norway, Alaska, Canada, and New Zealand, where there are mountainous coastlines once covered by glaciers.
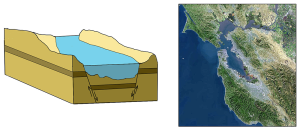
Tectonic estuaries are the result of tectonic movements, where faulting causes some sections of the crust to subside, and those lower elevation sections then get flooded with seawater. San Francisco Bay is an example of a tectonic estuary (Figure 4.6.4).
Estuaries are also classified based on their salinity and mixing patterns. The amount of mixing of fresh and salt water in an estuary depends on the rate at which fresh water enters the head of the estuary from river input, and the amount of seawater that enters the estuary mouth as a result of tidal movements. The input of fresh water is reflected in the flushing time of the estuary. This refers to the time it would take for the in-flowing fresh water to completely replace all the fresh water currently in the estuary. Seawater input is measured by the tidal volume, or tidal prism, which is the average volume of sea water entering and leaving the estuary during each tidal cycle. In other words, it is the volume difference between high and low tides. The interaction between the flushing time, tidal volume, and the shape of the estuary will determine the extent and type of water mixing within the estuary.
In a vertically mixed, or well-mixed estuary there is complete mixing of fresh and salt water from the surface to the bottom. In a particular location the salinity is constant at all depths, but across the estuary the salinity is lowest at the head where the fresh water enters, and is highest at the mouth, where the seawater comes in. This type of salinity profile usually occurs in shallower estuaries, where the shallow depths allow complete mixing from the surface to the bottom.
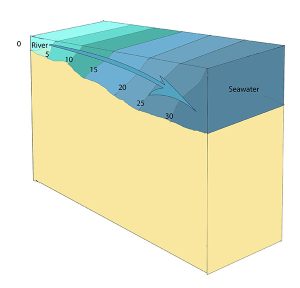
Slightly stratified or partially mixed estuaries have similar salinity profiles to vertically mixed estuaries, where salinity increases from the head to the mouth, but there is also a slight increase in salinity with depth at any point. This usually occurs in deeper estuaries than those that are well-mixed, where waves and currents mix the surface water, but the mixing may not extend all the way to the bottom.
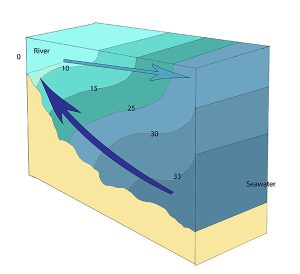
A salt wedge estuary occurs where the outflow of fresh water is strong enough to prevent the denser ocean water to enter through the surface, and where the estuary is deep enough that surface waves and turbulence have little mixing effect on the deeper water. Fresh water flows out along surface, salt water flows in at depth, creating a wedge shaped lens of seawater moving along the bottom. The surface water may remain mostly fresh throughout the estuary if there is no mixing, or it can become brackish depending on the level of mixing that occurs.
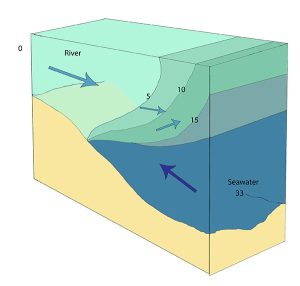
Highly stratified profiles are found in very deep estuaries, such as in fjords. Because of the depth, mixing of fresh and salt water only occurs near the surface, so in the upper layers salinity increases from the head to the mouth, but the deeper water is of standard ocean salinity.

Estuaries are very important commercially, as they are home to the majority of the world’s metropolitan areas, they serve as ports for industrial activity, and a large percentage of the world's population lives near estuaries. Estuaries are also very important biologically, especially in their role as the breeding grounds for many species of fish, birds, and invertebrates.
By Paul Webb, used under a CC-BY 4.0 international license. Download this book for free at https://rwu.pressbooks.pub/webboceanography/front-matter/preface/
Estuaries are partially enclosed bodies of water where the salt water is diluted by fresh water input from land, creating brackish water with a salinity somewhere between fresh water and normal seawater. Estuaries include many bays, inlets, and sounds, and are often subject to large temperature and salinity variations due to their enclosed nature and smaller size compared to the open ocean.
Estuaries can be classified geologically into four basic categories based on their method of origin. In all cases they are a result of rising sea level over the last 18,000 years, beginning with the end of the last ice age; a period that has seen a rise of about 130 m. The rise in sea level has flooded coastal areas that were previously above water, and prevented the estuaries from being filled in by all of the sediments that have been emptied into them.
The first type is a coastal plain estuary, or drowned river valley. These estuaries are formed as sea level rises and floods an existing river valley, mixing salt and fresh water to create the brackish conditions where the river meets the sea. These types of estuaries are common along the east coast of the United States, including major bodies such as the Chesapeake Bay, Delaware Bay, and Narragansett Bay (Figure 4.6.1). Coastal plain estuaries are usually shallow, and since there is a lot of sediment input from the rivers, there are often a number of depositional features associated with them such as spits and barrier islands.

The presence of sand bars, spits, and barrier islands can lead to bar-built estuaries, where a barrier is created between the mainland and the ocean. The water that remains inside the sand bar is cut off from complete mixing with the ocean, and receives freshwater input from the mainland, creating estuarine conditions (Figure 4.6.2).

Fjords are estuaries formed in deep, U-shaped basins that were carved out by advancing glaciers. When the glaciers melted and retreated, sea level rose and filled these troughs, creating deep, steep-walled fjords (Figure 4.6.3). Fjords are common in Norway, Alaska, Canada, and New Zealand, where there are mountainous coastlines once covered by glaciers.

Tectonic estuaries are the result of tectonic movements, where faulting causes some sections of the crust to subside, and those lower elevation sections then get flooded with seawater. San Francisco Bay is an example of a tectonic estuary (Figure 4.6.4).

Estuaries are also classified based on their salinity and mixing patterns. The amount of mixing of fresh and salt water in an estuary depends on the rate at which fresh water enters the head of the estuary from river input, and the amount of seawater that enters the estuary mouth as a result of tidal movements. The input of fresh water is reflected in the flushing time of the estuary. This refers to the time it would take for the in-flowing fresh water to completely replace all the fresh water currently in the estuary. Seawater input is measured by the tidal volume, or tidal prism, which is the average volume of sea water entering and leaving the estuary during each tidal cycle. In other words, it is the volume difference between high and low tides. The interaction between the flushing time, tidal volume, and the shape of the estuary will determine the extent and type of water mixing within the estuary.
In a vertically mixed, or well-mixed estuary there is complete mixing of fresh and salt water from the surface to the bottom. In a particular location the salinity is constant at all depths, but across the estuary the salinity is lowest at the head where the fresh water enters, and is highest at the mouth, where the seawater comes in. This type of salinity profile usually occurs in shallower estuaries, where the shallow depths allow complete mixing from the surface to the bottom.

Slightly stratified or partially mixed estuaries have similar salinity profiles to vertically mixed estuaries, where salinity increases from the head to the mouth, but there is also a slight increase in salinity with depth at any point. This usually occurs in deeper estuaries than those that are well-mixed, where waves and currents mix the surface water, but the mixing may not extend all the way to the bottom.

A salt wedge estuary occurs where the outflow of fresh water is strong enough to prevent the denser ocean water to enter through the surface, and where the estuary is deep enough that surface waves and turbulence have little mixing effect on the deeper water. Fresh water flows out along surface, salt water flows in at depth, creating a wedge shaped lens of seawater moving along the bottom. The surface water may remain mostly fresh throughout the estuary if there is no mixing, or it can become brackish depending on the level of mixing that occurs.

Highly stratified profiles are found in very deep estuaries, such as in fjords. Because of the depth, mixing of fresh and salt water only occurs near the surface, so in the upper layers salinity increases from the head to the mouth, but the deeper water is of standard ocean salinity.

Estuaries are very important commercially, as they are home to the majority of the world’s metropolitan areas, they serve as ports for industrial activity, and a large percentage of the world's population lives near estuaries. Estuaries are also very important biologically, especially in their role as the breeding grounds for many species of fish, birds, and invertebrates.
By Paul Webb, used under a CC-BY 4.0 international license. Download this book for free at https://rwu.pressbooks.pub/webboceanography/front-matter/preface/
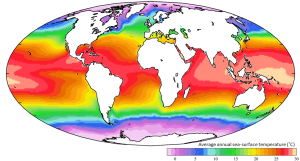
Generally ocean temperatures range from about -2o to 30o C (28-86o F). The warmest water tends to be surface water in low latitude regions, while the surface water at the poles is obviously much colder (Figure 5.6.1). Note that at equivalent latitudes, water on the eastern side of the ocean basins is colder than the water on the western side. This has to do with the pattern of surface currents. Even though surface water can be quite warm, most of the water in the oceans is deeper, colder water, so that the average temperature of the entire ocean is about 4o C, which is roughly the temperature inside your refrigerator.
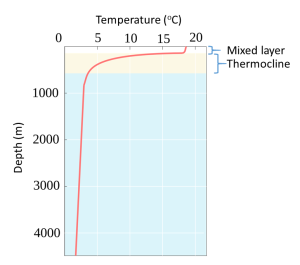
A typical temperature profile for open ocean, mid-latitude water is shown in Figure 5.6.2. Water is warmest at the surface, as it is warmed by the sun, and the sun's rays can only penetrate depths less than 1000 m. Since the surface water is warmer it is also less dense than the deep water, so it remains at the surface where it can be warmed even more. Temperature is fairly constant in the upper 100-200 m in what is called the mixed layer. The mixed layer results from surface winds, waves, and currents that mix the upper water and distribute the heat throughout this layer. Below the mixed layer there is a rapid decline in temperature over a fairly narrow increase in depth. This is called the thermocline. Below the thermocline the deep ocean temperature is fairly constant at about 2o C, continuing down to the bottom. There is little temperature change in the deep ocean, as it is far removed from significant heat sources, making it one of the most thermally stable regions on earth. Temperature may fluctuate by less than half a degree per year in the deep ocean (Figure 5.6.3).
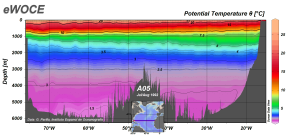
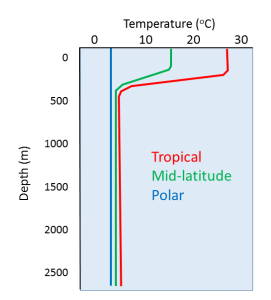
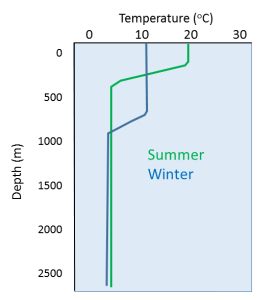
Temperature profiles vary at different latitudes, as the surface water is warmer near the equator and colder at the poles. In low latitude tropical regions the sea surface is much warmer, leading to a highly pronounced thermocline (Figure 5.6.4). Additionally, there is not much seasonal change in surface temperature in tropical regions, so there is little seasonal change in the profiles. In high latitude (polar) regions, there is little difference between the surface temperature and the deep water temperature, and temperature is fairly constant (and cold) at all depths. Polar waters therefore lack a strong thermocline, and as with tropical water, there is little seasonal change in temperatures. Mid-latitude temperate regions show greater seasonal fluctuations in surface temperature than the poles or the tropics; an 8-15o C difference from summer to winter in temperate zones, compared to only ~2o C in polar and tropical areas. In temperate regions, the surface water is much warmer in the summer and the thermocline is more pronounced compared to the winter months. But in the winter the thermocline is deeper at mid-latitudes than it is in the summer. This is because winter storms churn up the surface water more than occurs in the summer, creating a deeper mixed layer and thus a deeper thermocline (Figure 5.6.5).
Due to the high heat capacity of water, daily fluctuations in ocean temperature are fairly insignificant.
Our modern understanding of tide formation stems from Isaac Newton's Law of Universal Gravitation, which states that any two objects have a gravitational attraction to each other. The magnitude of the force is proportional to the masses of the objects, and inversely proportional to the square of the distance between the objects, according to the equation in Figure 3.5.1.
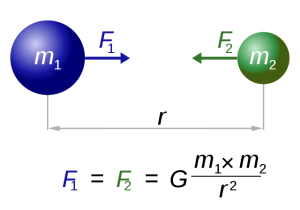
In the case of tides, there are a few other factors that modify this equation so that the distance (r) is cubed rather than squared, giving distance an even greater impact on tidal forces. But for our purposes, the important lesson is that the greater the masses of the objects, the greater the gravitational force, and the farther the objects are from each other, the weaker the force.
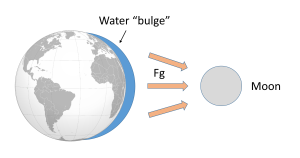
Such a gravitational force exists between the Earth and moon, attempting to pull them towards each other. Since the water covering Earth is fluid (unlike the solid land that is more resistant to tidal forces), this gravitational force pulls water towards the moon, creating a "bulge" of water on the side of the Earth facing the moon (Figure 3.5.2). This bulge always faces the moon, while the Earth rotates through it; the regions of Earth moving through the bulge experience a high tide, while those parts of the Earth away from the bulge experience a low tide.
If the tides were this simple, everywhere on Earth would see one high tide per day, as there would only be a bulge of water on the side closest to the moon. However, if you have ever looked at tide charts, or lived near the ocean, you probably know that in most places there are two high tides and two low tides per day. Where is this second high tide "bulge" coming from?
The gravitational force between the Earth and moon might be expected to draw the two objects closer together, however, this is not happening. This is because the inward gravitational force is opposed by outward forces that keep the Earth and moon apart. The outward force is an intertial force created by the rotation of the Earth and moon. Contrary to popular belief, the moon is not simply rotating around the Earth; in fact, the Earth and moon are both rotating around each other. Imagine the Earth and moon as equal-sized objects revolving around a point at their center of mass. If both objects had the same mass, the center of rotation would be a point equidistant between the two objects. But since the mass of the Earth is 82 times greater than the mass of the moon, the center of revolution must be closer to the Earth. As an analogy, think about two people on a see-saw. If the people are of roughly equal size, they can sit on either end of the see-saw at it will rotate around a point at equal distance between them. But if the two people have very different masses, such as a large adult and a small child, the larger person must move closer to the pivot point for the see-saw to rotate effectively. In the same way, the center of rotation between the Earth and the moon (the barycenter) must be located closer to the Earth. In fact, the center of rotation lies within the Earth, about 1600 km below the surface. As the Earth and moon rotate around the barycenter, the moon travels much farther than the Earth, giving the impression that the moon is rotating around Earth (Figure 3.5.3).
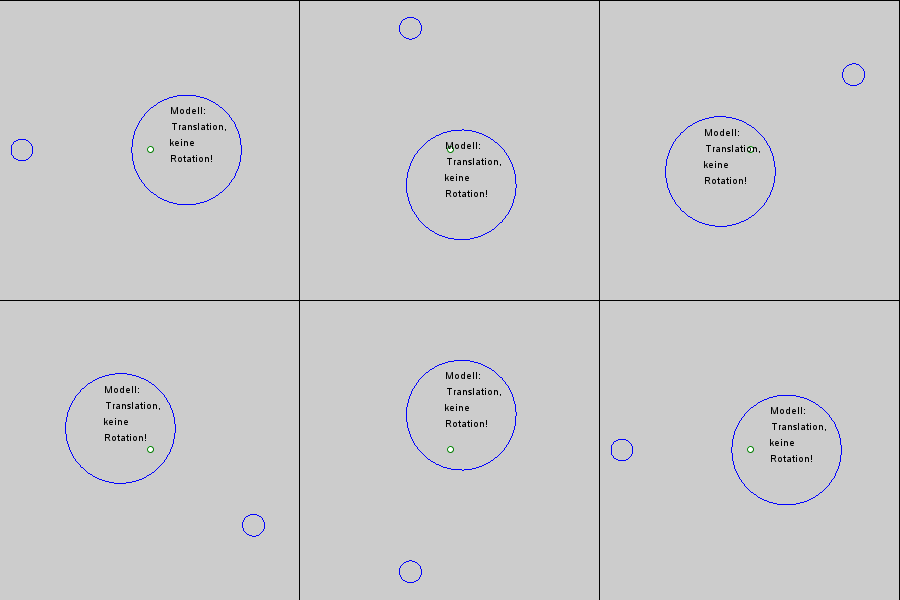
The rotation of the Earth-moon system creates an outward inertial force, which balances the gravitational force to keep the two bodies in their orbits. The inertial force has the same magnitude everywhere on Earth, and is always directed away from the moon. Gravitational force, on the other hand, is always directed towards the moon, and is stronger on the side of the Earth closest to the moon. Figure 3.5.4 describes how these forces combine to create the tidal forces. At point O in the center of the Earth, the gravitational force (Fg) and the inertial force (Fr) are equal, and cancel each other out. On the side of Earth closest to the moon, the inward gravitational force (Fg) is greater than the outward inertial force (Fr); the net resulting force (A) is directed towards the moon, and creates a bulge of water on the side facing the moon. On the side of Earth opposite the moon, the outward inertial force is greater than the inward gravitational force; the net resulting force (C) is directed away from the moon, creating a water bulge directed away from the moon.
Now, as the Earth rotates through a 24 hour day, each region passes through two bulges, and experiences two high tides and two low tides per day. This represents Newton's Equilibrium Theory of Tides, where there are two high tides and two low tides per day, of similar heights, each six hours apart. But as with everything else in oceanography, reality is much more complex than this idealized situation.

Some of the additional complexity is because in addition to the moon, the sun also exerts tide-affecting forces on Earth. The solar gravitational and inertial forces arise for the same reasons described above for the moon, but the magnitudes of the forces are different. The sun is 27 million times more massive than the moon, but it is 387 times farther away from the Earth. Despite its larger mass, because the sun is so much farther away than the moon, the sun's gravitational forces are only about half as strong as the moon's (remember that distance is cubed in the gravity equation). The sun thus creates its own, smaller water bulges, independent of the moon's, that contribute to the creation of tides.
When the sun, Earth and moon are aligned, as occurs during new and full moons, the solar and lunar bulges are also aligned, and add to each other (constructive interference; see section 4.2) creating an especially high tidal range; high high tides and low low tides (Figure 3.5.5). This period of maximum tidal range is called a spring tide, and they occur every two weeks.

When the sun, Earth and moon are at 90o to each other, the solar and lunar bulges are out of phase, and cancel each other out (destructive interference). Now the tidal range is small, with low high tides and high low tides (Figure 3.5.6). These are neap tides, and occur every two weeks, when the moon is in its 1/4 and 3/4 phases (Figure 3.5.7).


By Paul Webb, used under a CC-BY 4.0 international license. Download this book for free at https://rwu.pressbooks.pub/webboceanography/front-matter/preface/
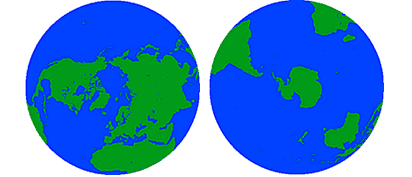
Let's begin by looking at a few basic facts about the oceans. We often think of Earth in terms of its land area, but in reality 71% of the Earth's surface is covered by oceans, while only 29% is land. Oceans cover an area of 139 million miles2 or 361 million km2, and contain a volume of about 1.37 billion km3 of water. All of this water is not distributed equally over the Earth; 61% of the Northern Hemisphere is covered by oceans, while in the Southern Hemisphere the oceans cover 81% of the surface area (Figure 1.1.1).

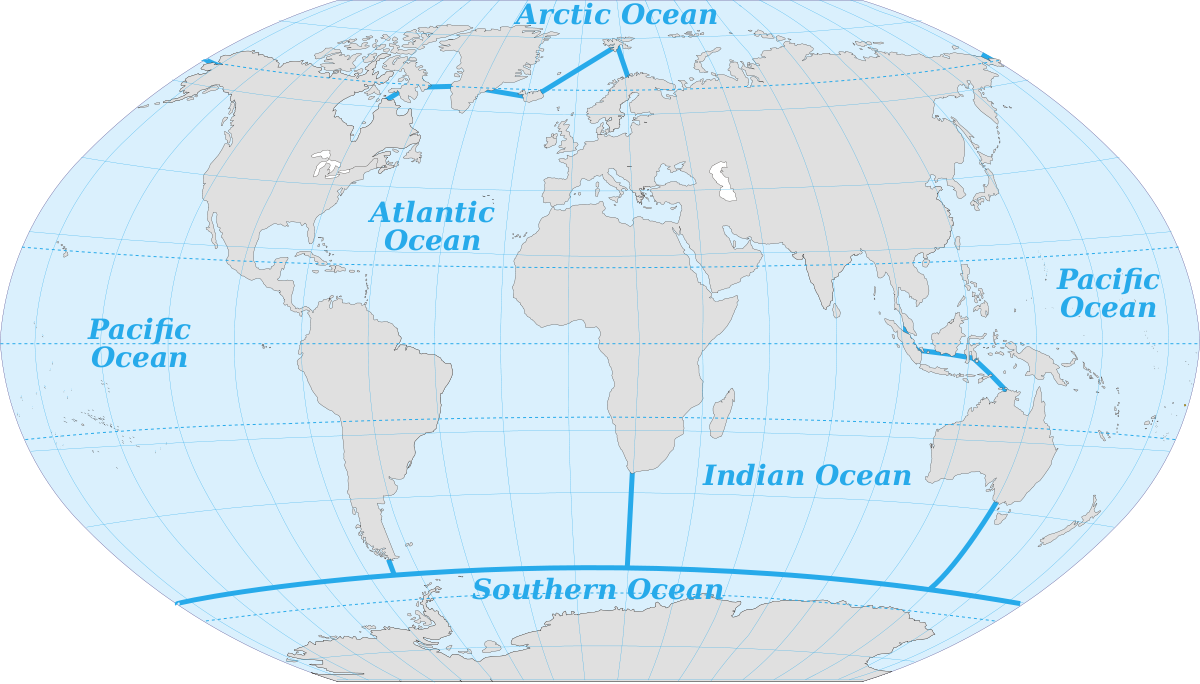
Various sources differ in the number of recognized ocean basins. Historically the major oceans were recognized as the Pacific, Atlantic, Indian, and Arctic Oceans. More recently, the Southern Ocean has been recognized as fifth named ocean, comprising all of the water from the coast of Antarctica to 60o S (Figure 1.1.2). In 2000 these boundaries were submitted to the International Hydrographic Organization for official recognition, but several countries do not recognize it as a separate ocean, but rather as the southern extension of the other major oceans. The Southern Ocean has its own unique characteristics, so for the purposes of this book we will include it as a separate ocean.
The oceans account for vast amounts of water, containing 97% of the water on Earth's surface, with over half of the water in the Pacific alone (Table 1.1.1).
Table 1.1.1 Percentage of Earth's water in various locations
| Pacific | 52% |
| Atlantic | 25% |
| Indian | 20% |
| Ice | 2% |
| Ground water | 0.6% |
| Atmosphere, lakes & rivers | 0.01% |
The average depth of the world ocean is about 3800m (12,500 ft), which is about four times deeper than the average land elevation is high (840m or 2800 ft). In fact Mt. Everest, the highest point on land, is 8848m (29,028 ft) high, while the deepest part of the ocean, the Challenger Deep of the Marianas Trench is approximately 10,920m (36,200 ft) deep. So you could submerge Mt. Everest in the Marianas Trench and it would still be covered by over 2 km of water! Because there is so much more water on Earth than there is land, if you could smooth out the land elevation the entire Earth would still be covered by water about 2700 m deep.
Of the major ocean basins, the Pacific is the largest (almost as large as all of the others combined), and is the deepest (Table 1.1.2).
Table 1.1.2 Area and depth of the major oceans
Watch the video below for some perspective on the size and depth of the oceans.
https://www.youtube.com/watch?v=UwVNkfCov1k
By Paul Webb, used under a CC-BY 4.0 international license. Download this book for free at https://rwu.pressbooks.pub/webboceanography/front-matter/preface/

