33 5.2 Origin of the Oceans
So how did the oceans form in the first place? The early Earth was formed through the accretion of various materials, and that a period of melting and intense volcanic activity followed. The materials that accreted on the early Earth contained the components that would eventually become our oceans and atmosphere. There are a few hypotheses concerning the origin of the oceans. One suggests that under the high pressures found in the Earth's interior, gases remain dissolved in magma. As these magmas rise to the surface through volcanic activity, the pressure is reduced and the gases are released through a process called outgassing. Volcanic activity releases many different gases, including water vapor, carbon dioxide (CO2), sulfur dioxide (SO2), carbon monoxide (CO), hydrogen sulfide (H2S), hydrogen gas, nitrogen, and methane (CH4). Lighter gases such as hydrogen and helium dissipated into space, but the heavier gases remained and formed Earth's early atmosphere, and potentially surface water. Another idea is that during this early bombardment, water was brought to Earth through comets, which are mostly dust and ice, and/or meteorites that may have contained traces of water that could have accumulated on the Earth's surface. These hypotheses are not mutually exclusive, and it's possible that all of them contributed to the formation of the oceans.
The rise of atmospheric oxygen
As the early Earth cooled, the water vapor in the atmosphere condensed and fell as rain. By about 4 billion years ago, the first permanent accumulations of water were present on Earth, forming the oceans and other bodies of water. Water moves between these different reservoirs through the hydrological cycle. Water is evaporated from the oceans, lakes, streams, the surface of the land, and plants (transpiration) by solar energy (Figure 5.2.1). It is moved through the atmosphere by winds and condenses to form clouds of water droplets or ice crystals. It comes back down as rain or snow and then flows through streams and rivers, into lakes, and eventually back to the oceans. Water on the surface and in streams and lakes infiltrates the ground to become groundwater. Groundwater slowly moves through the rock and surface materials; some returns to other streams and lakes, and some goes directly back to the oceans.
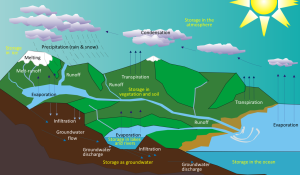
Water is stored in various reservoirs as it moves through this cycle. The largest, by far, is the oceans, accounting for 97% of the volume (Figure 5.2.2). Of course, that water is salty. The remaining 3% is fresh water. Two-thirds of our fresh water is stored in ice and one-third is stored as groundwater. The remaining fresh water — about 0.03% of the total — is stored in lakes, streams, vegetation, and the atmosphere.
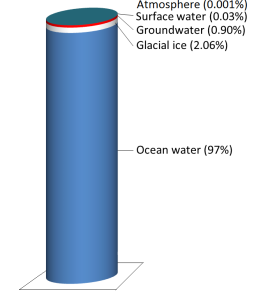
To put that in perspective, let’s think about putting all of Earth’s water into a 1 L jug. We start by almost filling the jug with 970 ml of water and 34 g of salt. Then we add one regular-sized (~20 mL) ice cube (representing glacial ice) and two teaspoons (~10 mL) of groundwater. All of the water that we see around us in lakes and streams and up in the sky can be represented by adding three more drops from an eyedropper.
Although the proportion of Earth’s water that is in the atmosphere is tiny, the actual volume is huge. At any given time, there is the equivalent of approximately 13,000 km3 of water in the air in the form of water vapor and water droplets in clouds. Water is evaporated from the oceans, vegetation, and lakes at a rate of 1,580 km3 per day, and just about exactly the same volume falls as rain and snow every day, over both the oceans and land. The precipitation that falls on land goes back to the ocean in the form of stream flow (117 km3/day) and groundwater flow (6 km3/day).
How did the oceans get salty?
Outgassing was responsible for ocean formation, but how did the ocean water get salty? Most of the salts and dissolved elements in the ocean were probably outgassed along with the water vapor, so the ocean has probably always been about as salty as it is now. But we know that rainfall and other processes weather rocks on the Earth's surface, and runoff carries dissolved substances into the ocean, contributing to its salinity. Yet despite this constant input, the ocean’s salt composition remains essentially the same. Therefore, the rate of input of new material must be balanced by the rate of removal; in other words, the oceans are in a steady state in regards to salinity.
There are multiple pathways through which dissolved ions enter the ocean; runoff from streams and rivers, volcanic activity, hydrothermal vents (see section 2.11), dissolution or decay of substances in the ocean, and groundwater input. Ions are removed from seawater as they are incorporated by living organisms (for example in shell production) or sediments, sea spray, percolation of water into the crust, or when sea water gets isolated from the ocean and evaporates.
The relationship between the input and removal of an ion can be examined through the concept of residence time, which is the average length of time a single atom of an element remains in the ocean before being removed. Residence time is calculated as:
[latex]\text { Residence time} =\frac{\text{amount of the substance in the ocean}}{\text {the rate at which the substance is added or removed}}[/latex]
There is great variation in residence times for different substances (Table 5.2.1). Generally speaking, substances that are readily used in biological processes have short residence times, as they are used up as they become available. Substances with longer residence times are less reactive, and may be a part of long-scale geological cycles.
Table 5.2.1 Residence times for some constituents of sea water
| Constituent | Residence time (years) |
|---|---|
| Chloride (Cl-) | 100,000,000 |
| Sodium (Na+) | 68,000,000 |
| Calcium (Ca2+) | 1,000,000 |
| Water | 4100 |
| Iron (Fe) | 200 |
So what about lakes? They are subjected to runoff and river input, so why aren't they salty like the oceans? One reason is that compared to the oceans, lakes and ponds are relatively temporary phenomena, so they do not last long enough to accumulate the same levels of ions as the oceans. Furthermore, lakes often have rivers flowing both into and out of them, so many ions are removed through the outflow, eventually finding their way to the oceans. The oceans only receive river input; there are no rivers flowing out of the ocean to remove these materials, so they are found in greater abundance in sea water. It should be noted that there are some lakes that contain water whose salt content may rival or exceed that of the ocean; these lakes usually lack river outflow. The Great Salt Lake in the western United States is an example.
By Paul Webb, used under a CC-BY 4.0 international license. Download this book for free at https://rwu.pressbooks.pub/webboceanography/front-matter/preface/
Modified from "Physical Geology" by Steven Earle used under a CC-BY 4.0 international license. Download this book for free at http://open.bccampus.ca
-
- a streamlined body shape for more efficient movement through the water
- a high metabolic rate that generates a lot of heat and layers of fat and, in some cases, fur, to conserve this heat
- modifications to their respiratory system to collect and retain large volumes of oxygen to allow deep and repetitive dives
- osmotic adaptations that free them from any requirement for fresh water
Order Cetacea: the whales
- Whales also have special adaptations, such as:
- A thick layer of blubber
- Their nostrils have migrated to the top of the head so that the animal doesn't have to come completely out of the water to breathe
- Large, deeply convoluted brains
- A special skin that "gives" to dampen out irregularities in water flow
- Bronchial cartilage that supports their lungs against pressure during deep dives
- Their blood is especially rich in hemoglobin to store more oxygen for diving
- They can slow their heartbeat while diving
- The blood supply can be reduced to all but the vital organs while diving, to conserve oxygen
Whale groups come in two 'flavors' (sub-Orders) – Odontocetes (toothed whales) and Mysticetes (baleen whales)
- Sperm whales are the largest of the toothed whales, reaching lengths up to 60 ft
- It also possesses the largest brain ever to have evolved on Earth
- They can dive to greater depths than any other air-breathing animal – to 3000 ft – and can stay down for over an hour
- Their head is filled with up to a ton of clear oil, presumably used to focus sound waves passing to their prey and back
Mysticetes (baleen whales): Also known as baleen whales, the Mysticetes are considered to be more highly evolved than the Odontocetes. Baleen is a bristly, bush, fibrous substance set in the jaws in overlapping plates; it looks like a gigantic comb.
- They feed on small planktonic arthropods (krill)
- Baleen is a straining mechanism
- The whale takes in a big gulp of water, closes its jaws, raises its tongue to expel the water, and the food is caught on the surface of the baleen
- The food is swallowed after being licked from the baleen by the whale's giant tongue
- Baleen whales include the blue, humpback and gray, among others

- The blue whale is probably the largest animal ever to have lived on Earth
- They're usually described as up to about 100 feet in length and up to about 200 tons
- this compares to three railroad cars in length and about 1600 people in weight
- Blue whales feed on krill, which are tiny shrimp-like crustaceans
- A mature blue whale consumes about 4 tons of krill per day when it's feeding
- For a 7 to 8 month period; it fasts when it is in tropical waters
- From December through April, the blue whale gorges on krill around the Antarctic
Humpback whale
- Humpbacks are stocky and seldom exceed 50 ft in length
- They're generally black above and white below, with extremely long, wing-like flippers
- They've become known for their "song", which are sounds with definite patterns and sequences
- All the whales in a given population sing the same song, but the song changes every year
- Humpbacks are also very acrobatic, at times leaping completely out of the water
- It is estimated that there are no more than 10,000 humpbacks surviving today
Gray whale
- The Gray whale is the only large whale with a heavily mottled appearance and a knobby ridge down the back
- Its 'natural' color is dark gray or black, but it's covered by a profusion of spots, scars, patches, and clusters of barnacles, which gives it a mottled, grayish appearance
- The Gray whale makes the longest migration of any mammal, an annual round-trip of some 10,000 miles from the Bering and Chukchi seas in the high Arctic to the warm lagoons of Baja California
- They were easily caught by whalers and almost became extinct in the 1940's
- Given full protection in 1946, they've made a successful comeback and their population, estimated at about 21,000, is now believed to be inline with the carrying capacity of their range
- The Gray whale is the most heavily parasitized of all cetaceans – playing host to three species of lice, some over an inch long – in one case, more than 100,000 of one species of louse were removed from a single whale
Written by Dr. Cristina Cardona.
Estuaries are partially enclosed bodies of water where the salt water is diluted by fresh water input from land, creating brackish water with a salinity somewhere between fresh water and normal seawater. Estuaries include many bays, inlets, and sounds, and are often subject to large temperature and salinity variations due to their enclosed nature and smaller size compared to the open ocean.
Estuaries can be classified geologically into four basic categories based on their method of origin. In all cases they are a result of rising sea level over the last 18,000 years, beginning with the end of the last ice age; a period that has seen a rise of about 130 m. The rise in sea level has flooded coastal areas that were previously above water, and prevented the estuaries from being filled in by all of the sediments that have been emptied into them.
The first type is a coastal plain estuary, or drowned river valley. These estuaries are formed as sea level rises and floods an existing river valley, mixing salt and fresh water to create the brackish conditions where the river meets the sea. These types of estuaries are common along the east coast of the United States, including major bodies such as the Chesapeake Bay, Delaware Bay, and Narragansett Bay (Figure 4.6.1). Coastal plain estuaries are usually shallow, and since there is a lot of sediment input from the rivers, there are often a number of depositional features associated with them such as spits and barrier islands.
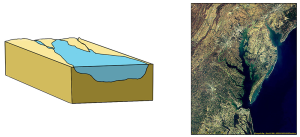
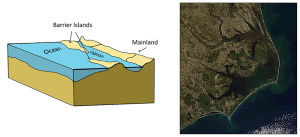
The presence of sand bars, spits, and barrier islands can lead to bar-built estuaries, where a barrier is created between the mainland and the ocean. The water that remains inside the sand bar is cut off from complete mixing with the ocean, and receives freshwater input from the mainland, creating estuarine conditions (Figure 4.6.2).
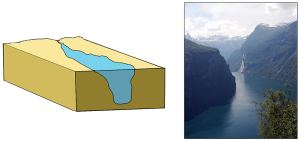
Fjords are estuaries formed in deep, U-shaped basins that were carved out by advancing glaciers. When the glaciers melted and retreated, sea level rose and filled these troughs, creating deep, steep-walled fjords (Figure 4.6.3). Fjords are common in Norway, Alaska, Canada, and New Zealand, where there are mountainous coastlines once covered by glaciers.
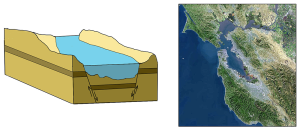
Tectonic estuaries are the result of tectonic movements, where faulting causes some sections of the crust to subside, and those lower elevation sections then get flooded with seawater. San Francisco Bay is an example of a tectonic estuary (Figure 4.6.4).
Estuaries are also classified based on their salinity and mixing patterns. The amount of mixing of fresh and salt water in an estuary depends on the rate at which fresh water enters the head of the estuary from river input, and the amount of seawater that enters the estuary mouth as a result of tidal movements. The input of fresh water is reflected in the flushing time of the estuary. This refers to the time it would take for the in-flowing fresh water to completely replace all the fresh water currently in the estuary. Seawater input is measured by the tidal volume, or tidal prism, which is the average volume of sea water entering and leaving the estuary during each tidal cycle. In other words, it is the volume difference between high and low tides. The interaction between the flushing time, tidal volume, and the shape of the estuary will determine the extent and type of water mixing within the estuary.
In a vertically mixed, or well-mixed estuary there is complete mixing of fresh and salt water from the surface to the bottom. In a particular location the salinity is constant at all depths, but across the estuary the salinity is lowest at the head where the fresh water enters, and is highest at the mouth, where the seawater comes in. This type of salinity profile usually occurs in shallower estuaries, where the shallow depths allow complete mixing from the surface to the bottom.
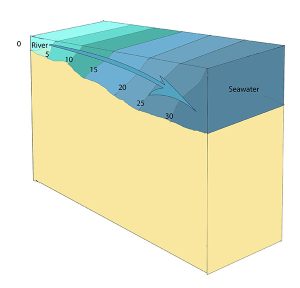
Slightly stratified or partially mixed estuaries have similar salinity profiles to vertically mixed estuaries, where salinity increases from the head to the mouth, but there is also a slight increase in salinity with depth at any point. This usually occurs in deeper estuaries than those that are well-mixed, where waves and currents mix the surface water, but the mixing may not extend all the way to the bottom.
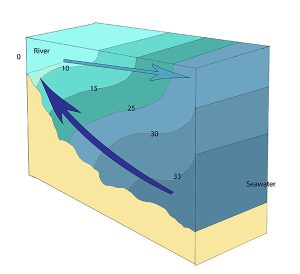
A salt wedge estuary occurs where the outflow of fresh water is strong enough to prevent the denser ocean water to enter through the surface, and where the estuary is deep enough that surface waves and turbulence have little mixing effect on the deeper water. Fresh water flows out along surface, salt water flows in at depth, creating a wedge shaped lens of seawater moving along the bottom. The surface water may remain mostly fresh throughout the estuary if there is no mixing, or it can become brackish depending on the level of mixing that occurs.

Highly stratified profiles are found in very deep estuaries, such as in fjords. Because of the depth, mixing of fresh and salt water only occurs near the surface, so in the upper layers salinity increases from the head to the mouth, but the deeper water is of standard ocean salinity.

Estuaries are very important commercially, as they are home to the majority of the world’s metropolitan areas, they serve as ports for industrial activity, and a large percentage of the world's population lives near estuaries. Estuaries are also very important biologically, especially in their role as the breeding grounds for many species of fish, birds, and invertebrates.
By Paul Webb, used under a CC-BY 4.0 international license. Download this book for free at https://rwu.pressbooks.pub/webboceanography/front-matter/preface/
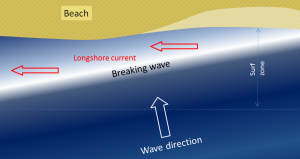
We learned in section 3.3 that refraction causes waves to approach parallel to shore. However, most waves still reach the shore at a small angle, and as each one arrives, it pushes water along the shore, creating what is known as a longshore current within the surf zone (the areas where waves are breaking) (Figure 4.2.1). Longshore currents can move up to 4 km/hr, strong enough to carry people with them, as everyone knows who has been swimming in the ocean only to look up and see that they have been carried far down the beach from their towel!
Another important effect of waves reaching the shore at an angle is that when they wash up onto the beach, they do so at an angle, but when that same wave water washes back down the beach, it moves straight down the slope of the beach (Figure 4.2.2). The upward-moving water, known as the swash, pushes sediment particles along the beach, while the downward-moving water, the backwash, brings them straight back. With every wave that washes up and then down the beach, particles of sediment are moved along the beach in a zigzag pattern.
The combined effects of sediment transport within the surf zone by the longshore current and sediment movement along the beach by swash and backwash is known as longshore transport, or littoral drift. Longshore transport moves a tremendous amount of sediment along coasts (both oceans and large lakes) around the world, and it is responsible for creating a variety of depositional features that we will discuss in section 4.4. The net movement of sediment due to longshore transport is to the south along both coasts of the continental United States, because the storms and high winds that originally create the swell tend to occur at higher latitudes and move to the south.

A rip current (often incorrectly called a "rip tide"; they are not really related to tides) is another type of current that develops in the nearshore area, and has the effect of returning water that has been pushed up to the shore by incoming waves or accumulated through longshore currents, particularly converging longshore currents. Rip currents often occur where there is a channel between sandbars that makes it easier for the retreating water to escape. As shown in Figure 4.2.3, rip currents flow straight out from the shore, and because the water is directed through a narrow space, the current can be very strong. The currents lose strength quickly just outside of the surf zone, but they can be dangerous to swimmers who get caught in them and are pulled away from shore. Swimmers caught in a rip current should not try to swim directly back to shore, as it is difficult to fight the current and the swimmer can quickly tire. Instead, swim parallel to the beach for a short distance until you are outside of the rip current, and then you can easily swim to shore.

Rip currents are visible in Figure 4.2.4, a beach at Tunquen in Chile near Valparaiso. As is evident from the photo, the rips correspond with embayments in the beach profile. Three of them are indicated with arrows, but it appears that there may be several others farther along the beach.

By Paul Webb, used under a CC-BY 4.0 international license. Download this book for free at https://rwu.pressbooks.pub/webboceanography/front-matter/preface/
Modified from "Physical Geology" by Steven Earle used under a CC-BY 4.0 international license. Download this book for free at http://open.bccampus.ca
Our modern understanding of tide formation stems from Isaac Newton's Law of Universal Gravitation, which states that any two objects have a gravitational attraction to each other. The magnitude of the force is proportional to the masses of the objects, and inversely proportional to the square of the distance between the objects, according to the equation in Figure 3.5.1.
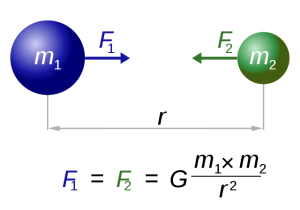
In the case of tides, there are a few other factors that modify this equation so that the distance (r) is cubed rather than squared, giving distance an even greater impact on tidal forces. But for our purposes, the important lesson is that the greater the masses of the objects, the greater the gravitational force, and the farther the objects are from each other, the weaker the force.
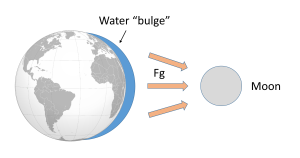
Such a gravitational force exists between the Earth and moon, attempting to pull them towards each other. Since the water covering Earth is fluid (unlike the solid land that is more resistant to tidal forces), this gravitational force pulls water towards the moon, creating a "bulge" of water on the side of the Earth facing the moon (Figure 3.5.2). This bulge always faces the moon, while the Earth rotates through it; the regions of Earth moving through the bulge experience a high tide, while those parts of the Earth away from the bulge experience a low tide.
If the tides were this simple, everywhere on Earth would see one high tide per day, as there would only be a bulge of water on the side closest to the moon. However, if you have ever looked at tide charts, or lived near the ocean, you probably know that in most places there are two high tides and two low tides per day. Where is this second high tide "bulge" coming from?
The gravitational force between the Earth and moon might be expected to draw the two objects closer together, however, this is not happening. This is because the inward gravitational force is opposed by outward forces that keep the Earth and moon apart. The outward force is an intertial force created by the rotation of the Earth and moon. Contrary to popular belief, the moon is not simply rotating around the Earth; in fact, the Earth and moon are both rotating around each other. Imagine the Earth and moon as equal-sized objects revolving around a point at their center of mass. If both objects had the same mass, the center of rotation would be a point equidistant between the two objects. But since the mass of the Earth is 82 times greater than the mass of the moon, the center of revolution must be closer to the Earth. As an analogy, think about two people on a see-saw. If the people are of roughly equal size, they can sit on either end of the see-saw at it will rotate around a point at equal distance between them. But if the two people have very different masses, such as a large adult and a small child, the larger person must move closer to the pivot point for the see-saw to rotate effectively. In the same way, the center of rotation between the Earth and the moon (the barycenter) must be located closer to the Earth. In fact, the center of rotation lies within the Earth, about 1600 km below the surface. As the Earth and moon rotate around the barycenter, the moon travels much farther than the Earth, giving the impression that the moon is rotating around Earth (Figure 3.5.3).

The rotation of the Earth-moon system creates an outward inertial force, which balances the gravitational force to keep the two bodies in their orbits. The inertial force has the same magnitude everywhere on Earth, and is always directed away from the moon. Gravitational force, on the other hand, is always directed towards the moon, and is stronger on the side of the Earth closest to the moon. Figure 3.5.4 describes how these forces combine to create the tidal forces. At point O in the center of the Earth, the gravitational force (Fg) and the inertial force (Fr) are equal, and cancel each other out. On the side of Earth closest to the moon, the inward gravitational force (Fg) is greater than the outward inertial force (Fr); the net resulting force (A) is directed towards the moon, and creates a bulge of water on the side facing the moon. On the side of Earth opposite the moon, the outward inertial force is greater than the inward gravitational force; the net resulting force (C) is directed away from the moon, creating a water bulge directed away from the moon.
Now, as the Earth rotates through a 24 hour day, each region passes through two bulges, and experiences two high tides and two low tides per day. This represents Newton's Equilibrium Theory of Tides, where there are two high tides and two low tides per day, of similar heights, each six hours apart. But as with everything else in oceanography, reality is much more complex than this idealized situation.

Some of the additional complexity is because in addition to the moon, the sun also exerts tide-affecting forces on Earth. The solar gravitational and inertial forces arise for the same reasons described above for the moon, but the magnitudes of the forces are different. The sun is 27 million times more massive than the moon, but it is 387 times farther away from the Earth. Despite its larger mass, because the sun is so much farther away than the moon, the sun's gravitational forces are only about half as strong as the moon's (remember that distance is cubed in the gravity equation). The sun thus creates its own, smaller water bulges, independent of the moon's, that contribute to the creation of tides.
When the sun, Earth and moon are aligned, as occurs during new and full moons, the solar and lunar bulges are also aligned, and add to each other (constructive interference; see section 4.2) creating an especially high tidal range; high high tides and low low tides (Figure 3.5.5). This period of maximum tidal range is called a spring tide, and they occur every two weeks.

When the sun, Earth and moon are at 90o to each other, the solar and lunar bulges are out of phase, and cancel each other out (destructive interference). Now the tidal range is small, with low high tides and high low tides (Figure 3.5.6). These are neap tides, and occur every two weeks, when the moon is in its 1/4 and 3/4 phases (Figure 3.5.7).


By Paul Webb, used under a CC-BY 4.0 international license. Download this book for free at https://rwu.pressbooks.pub/webboceanography/front-matter/preface/
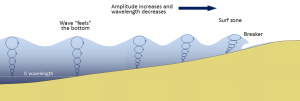
Most of the waves discussed in the previous section referred to deep water waves in the open ocean. But what happens when these waves move towards shore and encounter shallow water? Remember that in deep water, a wave’s speed depends on its wavelength, but in shallow water wave speed depends on the depth (section 3.1). When waves approach the shore they will "touch bottom" at a depth equal to half of their wavelength; in other words, when the water depth equals the depth of the wave base (Figure 3.3.1). At this point their behavior will begin to be influenced by the bottom.
When the wave touches the bottom, friction causes the wave to slow down. As one wave slows down, the one behind it catches up to it, thus decreasing the wavelength. However, the wave still contains the same amount of energy, so while the wavelength decreases, the wave height increases. Eventually the wave height exceeds 1/7 of the wavelength, and the wave becomes unstable and forms a breaker. Often breakers will start to curl forwards as they break. This is because the bottom of the wave begins to slow down before the top of the wave, as it is the first part to encounter the seafloor. So the crest of the wave gets “ahead” of the rest of the wave, but has no water underneath it to support it (Figure 3.3.1).
There are three main types of breakers: spilling, plunging, and surging. These are related to the steepness of the bottom, and how quickly the wave will slow down and its energy will get dissipated.
- Spilling breakers form on gently sloping or flatter beaches, where the energy of the wave is dissipated gradually. The wave slowly increases in height, then slowly collapses on itself (Figure 3.3.2). For surfers, these waves provide a longer ride, but they are less exciting.

- Plunging breakers form on more steeply-sloped shores, where there is a sudden slowing of the wave and the wave gets higher very quickly. The crest outruns the rest of the wave, curls forwards and breaks with a sudden loss of energy (Figure 3.3.3). These are the “pipeline” waves that surfers seek out.

- Surging breakers form on the steepest shorelines. The wave energy is compressed very suddenly right at the shoreline, and the wave breaks right onto the beach (Figure 3.3.4). These waves give too short (and potentially painful) a ride for surfers to enjoy.

Wave Refraction
Swell can be generated anywhere in the ocean and therefore can arrive at a beach from almost any direction. But if you have ever stood at the shore you have probably noticed that the waves usually approach the shore somewhat parallel to the coast. This is due to wave refraction. If a wave front approaches shore at an angle, the end of the wave front closest to shore will touch bottom before the rest of the wave. This will cause that shallower part of the wave to slow down first, while the rest of the wave that is still in deeper water will continue on at its regular speed. As more and more of the wave front encounters shallower water and slows down, the wave font refracts and the waves tend to align themselves nearly parallel to the shoreline (they are refracted towards the region of slower speed). As we will see in section 5.2, the fact that the waves do not arrive perfectly parallel to the beach causes longshore currents and longshore transport that run parallel to the shore.
Refraction can also explain why waves tend to be larger off of points and headlands, and smaller in bays. A wave front approaching shore will touch the bottom off of the point before it touches bottom in a bay. Once again, the shallower part of the wave front will slow down, and cause the rest of the wave front to refract towards the slower region (the point). Now all of the initial wave energy is concentrated in a relatively small area off of the point, creating large, high energy waves (Figure 3.3.6). In the bay, the refraction has caused the wave fronts to refract away from each other, dispersing the wave energy, and leading to calmer water and smaller waves. This makes the large waves of a “point break” ideal for surfing, while water is calmer in a bay, which is where people would launch a boat. This difference in wave energy also explains why there is net erosion on points, while sand and sediments get deposited in bays (see section 5.3).

By Paul Webb, used under a CC-BY 4.0 international license. Download this book for free at https://rwu.pressbooks.pub/webboceanography/front-matter/preface/
All of the salts and ions that dissolve in seawater contribute to its overall salinity. Salinity of seawater is usually expressed as the grams of salt per kilogram (1000 g) of seawater. On average, about 35 g of salt is present in each 1 kg of seawater, so we say that the average salinity of the ocean salinity is 35 parts per thousand (ppt). Note that 35 ppt is equivalent to 3.5% (parts per hundred). Some sources now use practical salinity units (PSU) to express salinity values, where 1 PSU = 1 ppt. The units are not included, so we can refer simply to a salinity of 35.
Many different substances are dissolved in the ocean, but six ions comprise about 99.4% of all the dissolved ions in seawater. These six major ions are (Table 5.3.1):
Table 5.3.1 The six major ions in seawater
| g/kg in seawater | % of ions by weight | |
|---|---|---|
| Chloride Cl- | 19.35 | 55.07% |
| Sodium Na+ | 10.76 | 30.6% |
| Sulfate SO42- | 2.71 | 7.72% |
| Magnesium Mg2+ | 1.29 | 3.68% |
| Calcium Ca2+ | 0.41 | 1.17% |
| Potassium K+ | 0.39 | 1.1% |
| 99.36% |
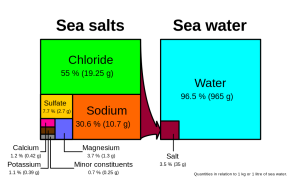
Chloride and sodium, the components of table salt (sodium chloride NaCl), make up over 85% of the ions in the ocean, which is why seawater tastes salty (Figure 5.3.1). In addition to the major constituents, there are numerous minor constituents; radionucleotides, organic compounds, metals etc. These minor constituents are found in concentrations of ppm (parts per million) or ppb (parts per billion), unlike the major ions that are far more abundant (ppt) (Table 5.3.2). To put this into perspective, 1 ppm = 1 mg/kg, or the equivalent of 1 teaspoon of sugar dissolved in 14,000 cans of soda. 1 ppb = 1 μg/kg, or the equivalent of 1 teaspoon of a substance dissolved in five Olympic-sized swimming pools! These minor constituents represent numerous substances, but together they make up less than 1% of the ions in the seawater. Some of these may be important as minerals and trace elements vital to living organisms, but they don’t have much impact on the overall salinity. But given the vast size of the oceans, even materials found in trace abundance can represent fairly large reservoirs. For example gold is a trace element in seawater, found in concentrations of parts per trillion, yet if you could extract all of the gold in just one km3 of seawater, it would be worth about $20 million!
Table 5.3.2 Concentrations of some minor elements in seawater
| g/kg in seawater | g/kg in seawater | ||
|---|---|---|---|
| Carbon | 0.028 | Iron | 2 x 10⁻⁶ |
| Nitrogen | 0.0115 | Manganese | 2 x 10⁻⁷ |
| Oxygen | 0.006 | Copper | 1 x 10⁻⁷ |
| Silicon | 0.002 | Mercury | 3 x 10⁻⁸ |
| Phosphorous | 6 x 10⁻⁵ | Gold | 4 x 10⁻⁹ |
| Uranium | 3.2 x 10⁻⁶ | Lead | 5 x 10⁻¹⁰ |
| Aluminum | 2 x 10⁻⁶ | Radon | 6 x 10-19 |
Because the six major ions in seawater comprise over 99% of the total salinity, changes in abundance of the minor constituents have little effect on overall salinity. Furthermore, the rule of constant proportions states that even though the absolute salinity of ocean water might differ in different places, the relative proportions of the six major ions within that water are always constant. For example, no matter the total salinity of a seawater sample, 55% of the total salinity will be due to chloride, 30% due to sodium, and so on. Since the proportion of these major ions does not change, we call these conservative ions.
Given these constant proportions, in order to calculate total salinity you can simply measure the concentration of just one of the major ions and use that value to calculate the rest. Traditionally chloride has been the ion measured because it is the most abundant, and thus the simplest to measure accurately. Multiplying the concentration of chloride by 1.8 gives the total salinity. For example, looking at Figure 5.3.1, 19.25 g/kg (ppt) chloride x 1.8 = 35 ppt. Today, for rapid measurements of salinity, electrical conductivity is often used rather than determining chloride concentrations (see box below).
Measuring salinity
There are a number of methods available for measuring the salinity of water. The most precise measurements utilize direct chemical analysis of the seawater in a lab setting, but there are a number of ways to get immediate salinity measurements in the field. For a quick estimate of salinity, a hand-held refractometer can be used (right).
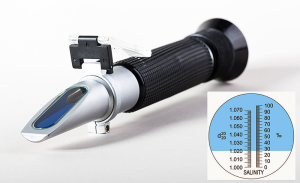
This instrument measures the degree of bending, or refraction, of light rays as they pass through a fluid. The greater the amount of dissolved salts in the sample, the greater the degree of light refraction. The observer traps a drop of water on the blue screen, and looks through the eyepiece. The dividing line between the blue and white sections of the scale (inset) can be used to read the salinity.
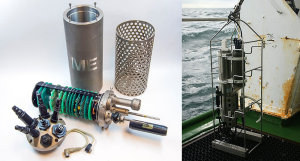
For more accurate measurements, most oceanographers use an instrument that measures electrical conductivity. An electrical current is passed between two electrodes immersed in water, and the higher the salinity, the more readily the current will be conducted (the ions in seawater conduct electrical currents). Conductivity probes are often bundled into an instrument called a CTD, which stands for Conductivity, Temperature, and Depth, which are the most commonly-measured parameters. Modern CTDs can be outfitted with an array of probes measuring parameters like light, turbidity (water clarity), dissolved gases etc. CTDs can be large instruments (below), but small hand-held salinity probes are also widely available.
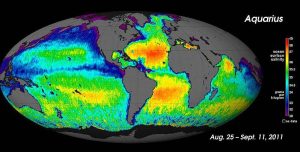
For large-scale salinity measurements, oceanographers can use satellites, such as the Aquarius satellite, which was able to measure surface salinity differences as small as 0.2 PSU as it mapped the ocean surface every seven days (below).
It is important to be aware that while the rule of constant proportions applies to most of the ocean, there may be certain coastal areas where lots of river discharge may alter these proportions slightly. Furthermore, it is important to remember that the rule of constant proportions only applies to the major ions. The proportions of the minor ions may fluctuate, but remember that they make a very minor contribution to overall salinity. Because the concentrations of the minor ions are not constant, these are referred to as non-conservative ions.
Why are the major ions found in constant proportions? There is constant input of ions from river runoff and other processes, usually in very different proportions from what is found in the ocean. So why don’t the proportions in the oceans change? Most of the ions discharged by rivers have fairly low residence times (see section 5.2) compared to ions in seawater, usually because they are used in biological processes. These low residence times do not allow the ions to accumulate and alter salinity. Also, the mixing time of the world ocean is around 1000 years, which is very short compared to the residence times of the major ions, which may be tens of millions of years long. So during the residence time of a single ion the ocean has mixed numerous times, and the major ions have become evenly distributed throughout the ocean.
Variations in Salinity
Total salinity in the open ocean averages 33-37 ppt, but it can vary significantly in different locations. But since the major ion proportions are constant, the regional salinity differences must be due more to water input and removal rather than the addition or removal of ions. Fresh water input comes through processes like precipitation, runoff from land, and melting ice. Fresh water removal primarily comes from evaporation and freezing (when seawater freezes, the resulting ice is mostly fresh water and the salts are excluded, making the remaining water even saltier). So differences in rates of precipitation, evaporation, river discharge, and ice formation play a significant role in regional salinity variations. For example, the Baltic Sea has a very low surface salinity of around 10 ppt, because it is a mostly enclosed body of water with lots of river input. Conversely, the Red Sea is very salty (around 40 ppt), due to the lack of precipitation and the hot environment which leads to high levels of evaporation.
One of the saltiest large bodies of water on Earth is the Dead Sea, between Israel and Jordan. Salinity in the Dead Sea is around 330 ppt, which is almost ten times saltier than the ocean. This extremely high salinity is a result of the hot, arid conditions in the Middle East that lead to high rates of evaporation. In addition, in the 1950s the flow from the Jordan River was diverted away from the Dead Sea, so there is no longer significant fresh water input. With no input and high evaporation, the water level in the Dead Sea is receding at a rate of about 1 m per year. The high salinity makes the water very dense, which creates buoyant forces that allow people to easily float at the surface. But the high salinity also means that the water is too salty for most living organisms, so only microbes are able to call it home; hence the name the Dead Sea. But as salty as the Dead Sea may be, it is not the saltiest body of water on Earth. That distinction currently belongs to Gaet’ale Pond in Ethiopia, with a salinity of 433 ppt!
Latitudinal Variations
While local conditions are important for determining salinity patterns in any single location, there are some global patterns that bear further investigation. Temperature is highest at the equator, and lowest near the poles, so we would expect higher rates of evaporation, and therefore higher salinity, in equatorial regions (Figure 5.3.2). This is generally the case, but in the figure below salinity right along the equator seems to be a little lower than at slightly higher latitudes. This is because equatorial regions also get a high volume of rain on a regular basis, which dilutes the surface water along the equator. So the higher salinities are found at subtropical, warm latitudes with high evaporation and less precipitation. At the poles there is little evaporation, which, coupled with ice and snow melting, produces a relatively low surface salinity. The image below shows high salinity in the Mediterranean Sea; this is located in a warm region with high evaporation, and the sea is largely isolated from mixing with the rest of the North Atlantic water, leading to high salinity. Lower salinities, such as those around southeast Asia, are the result of precipitation and high volumes of river input.

Figure 5.3.3 shows the mean global differences between evaporation and precipitation (evaporation - precipitation). Green colors represent areas where precipitation exceeds evaporation, while brown regions are where evaporation is greater than precipitations. Note the correlation between precipitation, evaporation, and surface salinity as seen in Figure 5.3.2.

Vertical Variation
In addition to geographical variation in salinity, there are also changes in salinity with depth. As we have seen, most differences in salinity are due to variations in evaporation, precipitation, runoff, and ice cover. All of these process occur at the ocean surface, not at depth, so the most pronounced differences in salinity should be found in surface waters. Salinity in deeper water remains relatively uniform, as it is unaffected by these surface processes. Some representative salinity profiles are shown in Figure 5.3.4. At the surface, the top 200 m or so show relatively uniform salinity in what is called the mixed layer. Winds, waves, and surface currents stir up the surface water, causing a great deal of mixing in this layer and fairly uniform salinity conditions. Below the mixed layer is an area of rapid salinity change over a small change in depth. This zone of rapid change is called the halocline, and it represents a transition between the mixed layer and the deep ocean. Below the halocline, salinity may show little variation down to the seafloor, as this region is far removed from the surface processes that impact salinity. In the figure below, note the low surface salinity at high latitudes, and higher surface salinity at low latitudes as discussed above. Yet despite the surface differences, salinity at depth in both locations may be very similar.

Radiant energy from the sun is important for several major oceanic processes:
- Climate, winds, and major ocean currents are ultimately dependent on solar radiation reaching the Earth and heating different areas to different degrees.
- Sunlight warms the surface water where much oceanic life lives.
- Solar radiation provides light for photosynthesis, which supports the entire ocean ecosystem.
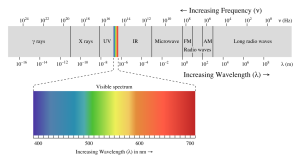
The energy reaching Earth from the sun is a form of electromagnetic radiation, which is represented by the electromagnetic spectrum (Figure 5.9.1). Electromagnetic waves vary in their frequency and wavelength. High frequency waves have very short wavelengths, and are very high energy forms of radiation, such as gamma rays and x-rays. These rays can easily penetrate the bodies of living organisms and interfere with individual atoms and molecules. At the other end of the spectrum are low energy, long wavelength waves such as radio waves, which do not pose a hazard to living organisms.
Most of the solar energy reaching the Earth is in the range of visible light, with wavelengths between about 400-700 nm. Each color of visible light has a unique wavelength, and together they make up white light. The shortest wavelengths are on the violet and ultraviolet end of the spectrum, while the longest wavelengths are at the red and infrared end. In between, the colors of the visible spectrum comprise the familiar "ROYGBIV"; red, orange, yellow, green, blue, indigo, and violet.
Water is very effective at absorbing incoming light, so the amount of light penetrating the ocean declines rapidly (is attenuated) with depth (Figure 5.9.2). At 1 m depth, only 45% of the solar energy that falls on the ocean surface remains. At 10 m depth only 16% of the light is still present, and only 1% of the original light is left at 100 m. No light penetrates beyond 1000 m.
In addition to overall attenuation, the oceans absorb the different wavelengths of light at different rates (Figure 5.9.2). The wavelengths at the extreme ends of the visible spectrum are attenuated faster than those wavelengths in the middle. Longer wavelengths are absorbed first; red is absorbed in the upper 10 m, orange by about 40 m, and yellow disappears before 100 m. Shorter wavelengths penetrate further, with blue and green light reaching the deepest depths.

This explains why everything appears blue under water. The colors we perceive depends on the wavelengths of light that are received by our eyes. If an object appears red to us, that is because the object reflects red light but absorbs all of the other colors. So the only color reaching our eyes is red. Under water, blue is the only color of light still available at depth, so that is the only color that can be reflected back to our eyes, and everything has a blue tinge under water. A red object at depth will not appear red to us because there is no red light available to reflect off of the object. Objects in water will only appear as their real colors near the surface where all wavelengths of light are still available, or if the other wavelengths of light are provided artificially, such as by illuminating the object with a dive light.
Water in the open ocean appears clear and blue because it contains much less particulate matter, such as phytoplankton or other suspended particles, and the clearer the water, the deeper the light penetration. Blue light penetrates deeply and is scattered by the water molecules, while all other colors are absorbed; thus the water appears blue. On the other hand, coastal water often appears greenish (Figure 5.9.2). Coastal water contains much more suspended silt and algae and microscopic organisms than the open ocean. Many of these organisms, such as phytoplankton, absorb light in the blue and red range through their photosynthetic pigments, leaving green as the dominant wavelength of reflected light. Therefore the higher the phytoplankton concentration in water, the greener it appears. Small silt particles may also absorb blue light, further shifting the color of water away from blue when there are high concentrations of suspended particles.
The ocean can be divided into depth layers depending on the amount of light penetration, as discussed in section 1.3 (Figure 5.9.3). The upper 200 m is referred to as the photic or euphotic zone. This represents the region where enough light can penetrate to support photosynthesis, and it corresponds to the epipelagic zone. From 200-1000 m lies the dysphotic zone, or the twilight zone (corresponding with the mesopelagic zone). There is still some light at these depths, but not enough to support photosynthesis. Below 1000 m is the aphotic (or midnight) zone, where no light penetrates. This region includes the majority of the ocean volume, which exists in complete darkness.

Our modern understanding of tide formation stems from Isaac Newton's Law of Universal Gravitation, which states that any two objects have a gravitational attraction to each other. The magnitude of the force is proportional to the masses of the objects, and inversely proportional to the square of the distance between the objects, according to the equation in Figure 3.5.1.

In the case of tides, there are a few other factors that modify this equation so that the distance (r) is cubed rather than squared, giving distance an even greater impact on tidal forces. But for our purposes, the important lesson is that the greater the masses of the objects, the greater the gravitational force, and the farther the objects are from each other, the weaker the force.
Such a gravitational force exists between the Earth and moon, attempting to pull them towards each other. Since the water covering Earth is fluid (unlike the solid land that is more resistant to tidal forces), this gravitational force pulls water towards the moon, creating a "bulge" of water on the side of the Earth facing the moon (Figure 3.5.2). This bulge always faces the moon, while the Earth rotates through it; the regions of Earth moving through the bulge experience a high tide, while those parts of the Earth away from the bulge experience a low tide.

If the tides were this simple, everywhere on Earth would see one high tide per day, as there would only be a bulge of water on the side closest to the moon. However, if you have ever looked at tide charts, or lived near the ocean, you probably know that in most places there are two high tides and two low tides per day. Where is this second high tide "bulge" coming from?
The gravitational force between the Earth and moon might be expected to draw the two objects closer together, however, this is not happening. This is because the inward gravitational force is opposed by outward forces that keep the Earth and moon apart. The outward force is an intertial force created by the rotation of the Earth and moon. Contrary to popular belief, the moon is not simply rotating around the Earth; in fact, the Earth and moon are both rotating around each other. Imagine the Earth and moon as equal-sized objects revolving around a point at their center of mass. If both objects had the same mass, the center of rotation would be a point equidistant between the two objects. But since the mass of the Earth is 82 times greater than the mass of the moon, the center of revolution must be closer to the Earth. As an analogy, think about two people on a see-saw. If the people are of roughly equal size, they can sit on either end of the see-saw at it will rotate around a point at equal distance between them. But if the two people have very different masses, such as a large adult and a small child, the larger person must move closer to the pivot point for the see-saw to rotate effectively. In the same way, the center of rotation between the Earth and the moon (the barycenter) must be located closer to the Earth. In fact, the center of rotation lies within the Earth, about 1600 km below the surface. As the Earth and moon rotate around the barycenter, the moon travels much farther than the Earth, giving the impression that the moon is rotating around Earth (Figure 3.5.3).

The rotation of the Earth-moon system creates an outward inertial force, which balances the gravitational force to keep the two bodies in their orbits. The inertial force has the same magnitude everywhere on Earth, and is always directed away from the moon. Gravitational force, on the other hand, is always directed towards the moon, and is stronger on the side of the Earth closest to the moon. Figure 3.5.4 describes how these forces combine to create the tidal forces. At point O in the center of the Earth, the gravitational force (Fg) and the inertial force (Fr) are equal, and cancel each other out. On the side of Earth closest to the moon, the inward gravitational force (Fg) is greater than the outward inertial force (Fr); the net resulting force (A) is directed towards the moon, and creates a bulge of water on the side facing the moon. On the side of Earth opposite the moon, the outward inertial force is greater than the inward gravitational force; the net resulting force (C) is directed away from the moon, creating a water bulge directed away from the moon.
Now, as the Earth rotates through a 24 hour day, each region passes through two bulges, and experiences two high tides and two low tides per day. This represents Newton's Equilibrium Theory of Tides, where there are two high tides and two low tides per day, of similar heights, each six hours apart. But as with everything else in oceanography, reality is much more complex than this idealized situation.

Some of the additional complexity is because in addition to the moon, the sun also exerts tide-affecting forces on Earth. The solar gravitational and inertial forces arise for the same reasons described above for the moon, but the magnitudes of the forces are different. The sun is 27 million times more massive than the moon, but it is 387 times farther away from the Earth. Despite its larger mass, because the sun is so much farther away than the moon, the sun's gravitational forces are only about half as strong as the moon's (remember that distance is cubed in the gravity equation). The sun thus creates its own, smaller water bulges, independent of the moon's, that contribute to the creation of tides.
When the sun, Earth and moon are aligned, as occurs during new and full moons, the solar and lunar bulges are also aligned, and add to each other (constructive interference; see section 4.2) creating an especially high tidal range; high high tides and low low tides (Figure 3.5.5). This period of maximum tidal range is called a spring tide, and they occur every two weeks.

When the sun, Earth and moon are at 90o to each other, the solar and lunar bulges are out of phase, and cancel each other out (destructive interference). Now the tidal range is small, with low high tides and high low tides (Figure 3.5.6). These are neap tides, and occur every two weeks, when the moon is in its 1/4 and 3/4 phases (Figure 3.5.7).


By Paul Webb, used under a CC-BY 4.0 international license. Download this book for free at https://rwu.pressbooks.pub/webboceanography/front-matter/preface/
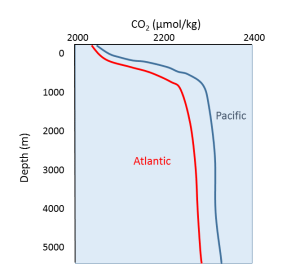
Oxygen and carbon dioxide are involved in the same biological processes in the ocean, but in opposite ways; photosynthesis consumes CO2 and produces O2, while respiration and decomposition consume O2 and produce CO2. Therefore it should not be surprising that oceanic CO2 profiles are essentially the opposite of dissolved oxygen profiles (Figure 5.5.1). At the surface, photosynthesis consumes CO2 so CO2 levels remain relatively low. In addition, organisms that utilize carbonate in their shells are common near the surface, further reducing the amount of dissolved CO2.
In deeper water, CO2 concentration increases as respiration exceeds photosynthesis, and decomposition of organic matter adds additional CO2 to the water. As with oxygen, there is often more CO2 at depth because cold bottom water holds more dissolved gases, and high pressures increase solubility. Deep water in the Pacific contains more CO2 than the Atlantic as the Pacific water is older and has accumulated more CO2 from the respiration of benthic organisms.
But the behavior of carbon dioxide in the ocean is more complex than the figure above would suggest. When CO2 gas dissolves in the ocean, it interacts with the water to produce a number of different compounds according to the reaction below:
CO2 + H2O ↔ H2CO3 ↔ H+ + HCO3- ↔ 2H+ + CO32-
CO2 reacts with water to produce carbonic acid (H2CO3), which then dissociates into bicarbonate (HCO3-) and hydrogen ions (H+). The bicarbonate ions can further dissociate into carbonate (CO32-) and additional hydrogen ions (Figure 5.5.2).
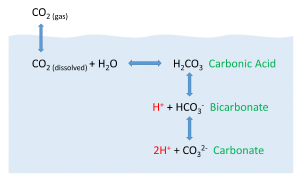
Most of the CO2 dissolving or produced in the ocean is quickly converted to bicarbonate. Bicarbonate accounts for about 92% of the CO2 dissolved in the ocean, and carbonate represents around 7%, so only about 1% remains as CO2, and little gets absorbed back into the air. The rapid conversion of CO2 into other forms prevents it from reaching equilibrium with the atmosphere, and in this way, water can hold 50-60 times as much CO2 and its derivatives as the air.
CO2 and pH
The equation above also illustrates carbon dioxide's role as a buffer, regulating the pH of the ocean. Recall that pH reflects the acidity or basicity of a solution. The pH scale runs from 0-14, with 0 indicating a very strong acid, and 14 representing highly basic conditions. A solution with a pH of 7 is considered neutral, as is the case for pure water. The pH value is calculated as the negative logarithm of the hydrogen ion concentration according to the equation:
pH = -log10[H+]
Therefore, a high concentration of H+ ions leads to a low pH and acidic condition, while a low H+ concentration indicates a high pH and basic conditions. It should also be noted that pH is described on a logarithmic scale, so every one point change on the pH scale actually represents an order of magnitude (10 x) change in solution strength. So a pH of 6 is 10 times more acidic than a pH of 7, and a pH of 5 is 100 times (10 x 10) more acidic than a pH of 7.
Carbon dioxide and the other carbon compounds listed above play an important role in buffering the pH of the ocean. Currently, the average pH for the global ocean is about 8.1, meaning seawater is slightly basic. Because most of the inorganic carbon dissolved in the ocean exists in the form of bicarbonate, bicarbonate can respond to disturbances in pH by releasing or incorporating hydrogen ions into the various carbon compounds. If pH rises (low [H+]), bicarbonate may dissociate into carbonate, and release more H+ ions, thus lowering pH. Conversely, if pH gets too low (high [H+]), bicarbonate and carbonate may incorporate some of those H+ ions and produce bicarbonate, carbonic acid, or CO2 to remove H+ ions and raise the pH. By shuttling H+ ions back and forth between the various compounds in this equation, the pH of the ocean is regulated and conditions remain favorable for life.
CO2 and Ocean Acidification
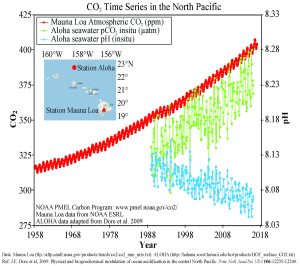
In recent years there has been rising concern about the phenomenon of ocean acidification. As described in the processes above, the addition of CO2 to seawater lowers the pH of the water. As anthropogenic sources of atmospheric CO2 have increased since the Industrial Revolution, the oceans have been absorbing an increasing amount of CO2, and researchers have documented a decline in ocean pH from about 8.2 to 8.1 in the last century. This may not appear to be much of a change, but remember that since pH is on a logarithmic scale, this decline represents a 30% increase in acidity. It should be noted that even at a pH of 8.1 the ocean is not actually acidic; the term "acidification" refers to the fact that the pH is becoming lower, i.e. the water is moving towards more acidic conditions.
Figure 5.5.3 presents data from observation stations in and around the Hawaiian Islands. As atmospheric levels of CO2 have increased, the CO2 content of the ocean water has also increased, leading to a reduction in seawater pH. Some models suggest that at the current rate of CO2 addition to the atmosphere, by 2100 ocean pH may be further reduced to around 7.8, which would represent more than a 120% increase in ocean acidity since the Industrial Revolution.
Why is this important? Declining pH can impact many biological systems. Of particular concern are organisms that secrete calcium carbonate shells or skeletons, such as corals, shellfish, and may planktonic organisms. At lower pH levels, calcium carbonate dissolves, eroding the shells and skeletons of these organisms (Figure 5.5.4).

Not only does a declining pH lead to increased rates of dissolution of calcium carbonate, it also diminishes the amount of free carbonate ions in the water. The relative proportions of the different carbon compounds in seawater is dependent on pH (Figure 5.5.6). As pH declines, the amount of carbonate declines, so there is less available for organisms to incorporate into their shells and skeletons. So ocean acidification both dissolves existing shells and makes it harder for shell formation to occur.

Additional links for more information:
- NOAA Ocean Acidification Program website http://oceanacidification.noaa.gov/
All of the salts and ions that dissolve in seawater contribute to its overall salinity. Salinity of seawater is usually expressed as the grams of salt per kilogram (1000 g) of seawater. On average, about 35 g of salt is present in each 1 kg of seawater, so we say that the average salinity of the ocean salinity is 35 parts per thousand (ppt). Note that 35 ppt is equivalent to 3.5% (parts per hundred). Some sources now use practical salinity units (PSU) to express salinity values, where 1 PSU = 1 ppt. The units are not included, so we can refer simply to a salinity of 35.
Many different substances are dissolved in the ocean, but six ions comprise about 99.4% of all the dissolved ions in seawater. These six major ions are (Table 5.3.1):
Table 5.3.1 The six major ions in seawater
| g/kg in seawater | % of ions by weight | |
|---|---|---|
| Chloride Cl- | 19.35 | 55.07% |
| Sodium Na+ | 10.76 | 30.6% |
| Sulfate SO42- | 2.71 | 7.72% |
| Magnesium Mg2+ | 1.29 | 3.68% |
| Calcium Ca2+ | 0.41 | 1.17% |
| Potassium K+ | 0.39 | 1.1% |
| 99.36% |

Chloride and sodium, the components of table salt (sodium chloride NaCl), make up over 85% of the ions in the ocean, which is why seawater tastes salty (Figure 5.3.1). In addition to the major constituents, there are numerous minor constituents; radionucleotides, organic compounds, metals etc. These minor constituents are found in concentrations of ppm (parts per million) or ppb (parts per billion), unlike the major ions that are far more abundant (ppt) (Table 5.3.2). To put this into perspective, 1 ppm = 1 mg/kg, or the equivalent of 1 teaspoon of sugar dissolved in 14,000 cans of soda. 1 ppb = 1 μg/kg, or the equivalent of 1 teaspoon of a substance dissolved in five Olympic-sized swimming pools! These minor constituents represent numerous substances, but together they make up less than 1% of the ions in the seawater. Some of these may be important as minerals and trace elements vital to living organisms, but they don’t have much impact on the overall salinity. But given the vast size of the oceans, even materials found in trace abundance can represent fairly large reservoirs. For example gold is a trace element in seawater, found in concentrations of parts per trillion, yet if you could extract all of the gold in just one km3 of seawater, it would be worth about $20 million!
Table 5.3.2 Concentrations of some minor elements in seawater
| g/kg in seawater | g/kg in seawater | ||
|---|---|---|---|
| Carbon | 0.028 | Iron | 2 x 10⁻⁶ |
| Nitrogen | 0.0115 | Manganese | 2 x 10⁻⁷ |
| Oxygen | 0.006 | Copper | 1 x 10⁻⁷ |
| Silicon | 0.002 | Mercury | 3 x 10⁻⁸ |
| Phosphorous | 6 x 10⁻⁵ | Gold | 4 x 10⁻⁹ |
| Uranium | 3.2 x 10⁻⁶ | Lead | 5 x 10⁻¹⁰ |
| Aluminum | 2 x 10⁻⁶ | Radon | 6 x 10-19 |
Because the six major ions in seawater comprise over 99% of the total salinity, changes in abundance of the minor constituents have little effect on overall salinity. Furthermore, the rule of constant proportions states that even though the absolute salinity of ocean water might differ in different places, the relative proportions of the six major ions within that water are always constant. For example, no matter the total salinity of a seawater sample, 55% of the total salinity will be due to chloride, 30% due to sodium, and so on. Since the proportion of these major ions does not change, we call these conservative ions.
Given these constant proportions, in order to calculate total salinity you can simply measure the concentration of just one of the major ions and use that value to calculate the rest. Traditionally chloride has been the ion measured because it is the most abundant, and thus the simplest to measure accurately. Multiplying the concentration of chloride by 1.8 gives the total salinity. For example, looking at Figure 5.3.1, 19.25 g/kg (ppt) chloride x 1.8 = 35 ppt. Today, for rapid measurements of salinity, electrical conductivity is often used rather than determining chloride concentrations (see box below).
Measuring salinity
There are a number of methods available for measuring the salinity of water. The most precise measurements utilize direct chemical analysis of the seawater in a lab setting, but there are a number of ways to get immediate salinity measurements in the field. For a quick estimate of salinity, a hand-held refractometer can be used (right).

This instrument measures the degree of bending, or refraction, of light rays as they pass through a fluid. The greater the amount of dissolved salts in the sample, the greater the degree of light refraction. The observer traps a drop of water on the blue screen, and looks through the eyepiece. The dividing line between the blue and white sections of the scale (inset) can be used to read the salinity.
For more accurate measurements, most oceanographers use an instrument that measures electrical conductivity. An electrical current is passed between two electrodes immersed in water, and the higher the salinity, the more readily the current will be conducted (the ions in seawater conduct electrical currents). Conductivity probes are often bundled into an instrument called a CTD, which stands for Conductivity, Temperature, and Depth, which are the most commonly-measured parameters. Modern CTDs can be outfitted with an array of probes measuring parameters like light, turbidity (water clarity), dissolved gases etc. CTDs can be large instruments (below), but small hand-held salinity probes are also widely available.

For large-scale salinity measurements, oceanographers can use satellites, such as the Aquarius satellite, which was able to measure surface salinity differences as small as 0.2 PSU as it mapped the ocean surface every seven days (below).
It is important to be aware that while the rule of constant proportions applies to most of the ocean, there may be certain coastal areas where lots of river discharge may alter these proportions slightly. Furthermore, it is important to remember that the rule of constant proportions only applies to the major ions. The proportions of the minor ions may fluctuate, but remember that they make a very minor contribution to overall salinity. Because the concentrations of the minor ions are not constant, these are referred to as non-conservative ions.
Why are the major ions found in constant proportions? There is constant input of ions from river runoff and other processes, usually in very different proportions from what is found in the ocean. So why don’t the proportions in the oceans change? Most of the ions discharged by rivers have fairly low residence times (see section 5.2) compared to ions in seawater, usually because they are used in biological processes. These low residence times do not allow the ions to accumulate and alter salinity. Also, the mixing time of the world ocean is around 1000 years, which is very short compared to the residence times of the major ions, which may be tens of millions of years long. So during the residence time of a single ion the ocean has mixed numerous times, and the major ions have become evenly distributed throughout the ocean.
Variations in Salinity
Total salinity in the open ocean averages 33-37 ppt, but it can vary significantly in different locations. But since the major ion proportions are constant, the regional salinity differences must be due more to water input and removal rather than the addition or removal of ions. Fresh water input comes through processes like precipitation, runoff from land, and melting ice. Fresh water removal primarily comes from evaporation and freezing (when seawater freezes, the resulting ice is mostly fresh water and the salts are excluded, making the remaining water even saltier). So differences in rates of precipitation, evaporation, river discharge, and ice formation play a significant role in regional salinity variations. For example, the Baltic Sea has a very low surface salinity of around 10 ppt, because it is a mostly enclosed body of water with lots of river input. Conversely, the Red Sea is very salty (around 40 ppt), due to the lack of precipitation and the hot environment which leads to high levels of evaporation.
One of the saltiest large bodies of water on Earth is the Dead Sea, between Israel and Jordan. Salinity in the Dead Sea is around 330 ppt, which is almost ten times saltier than the ocean. This extremely high salinity is a result of the hot, arid conditions in the Middle East that lead to high rates of evaporation. In addition, in the 1950s the flow from the Jordan River was diverted away from the Dead Sea, so there is no longer significant fresh water input. With no input and high evaporation, the water level in the Dead Sea is receding at a rate of about 1 m per year. The high salinity makes the water very dense, which creates buoyant forces that allow people to easily float at the surface. But the high salinity also means that the water is too salty for most living organisms, so only microbes are able to call it home; hence the name the Dead Sea. But as salty as the Dead Sea may be, it is not the saltiest body of water on Earth. That distinction currently belongs to Gaet’ale Pond in Ethiopia, with a salinity of 433 ppt!
Latitudinal Variations
While local conditions are important for determining salinity patterns in any single location, there are some global patterns that bear further investigation. Temperature is highest at the equator, and lowest near the poles, so we would expect higher rates of evaporation, and therefore higher salinity, in equatorial regions (Figure 5.3.2). This is generally the case, but in the figure below salinity right along the equator seems to be a little lower than at slightly higher latitudes. This is because equatorial regions also get a high volume of rain on a regular basis, which dilutes the surface water along the equator. So the higher salinities are found at subtropical, warm latitudes with high evaporation and less precipitation. At the poles there is little evaporation, which, coupled with ice and snow melting, produces a relatively low surface salinity. The image below shows high salinity in the Mediterranean Sea; this is located in a warm region with high evaporation, and the sea is largely isolated from mixing with the rest of the North Atlantic water, leading to high salinity. Lower salinities, such as those around southeast Asia, are the result of precipitation and high volumes of river input.

Figure 5.3.3 shows the mean global differences between evaporation and precipitation (evaporation - precipitation). Green colors represent areas where precipitation exceeds evaporation, while brown regions are where evaporation is greater than precipitations. Note the correlation between precipitation, evaporation, and surface salinity as seen in Figure 5.3.2.

Vertical Variation
In addition to geographical variation in salinity, there are also changes in salinity with depth. As we have seen, most differences in salinity are due to variations in evaporation, precipitation, runoff, and ice cover. All of these process occur at the ocean surface, not at depth, so the most pronounced differences in salinity should be found in surface waters. Salinity in deeper water remains relatively uniform, as it is unaffected by these surface processes. Some representative salinity profiles are shown in Figure 5.3.4. At the surface, the top 200 m or so show relatively uniform salinity in what is called the mixed layer. Winds, waves, and surface currents stir up the surface water, causing a great deal of mixing in this layer and fairly uniform salinity conditions. Below the mixed layer is an area of rapid salinity change over a small change in depth. This zone of rapid change is called the halocline, and it represents a transition between the mixed layer and the deep ocean. Below the halocline, salinity may show little variation down to the seafloor, as this region is far removed from the surface processes that impact salinity. In the figure below, note the low surface salinity at high latitudes, and higher surface salinity at low latitudes as discussed above. Yet despite the surface differences, salinity at depth in both locations may be very similar.


