32 5.1 Properties of Water
The most obvious feature of the oceans is that they contain water. Water is so ubiquitous that it may not seem like a very interesting substance, but it has many unique properties that impact global oceanographic and climatological processes. Many of these processes are due to hydrogen bonds forming between water molecules.
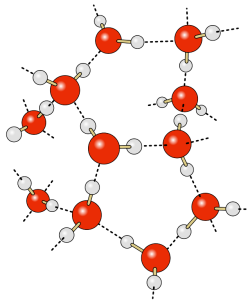
The water molecule consists of two hydrogen atoms and one oxygen atom. The electrons responsible for the bonds between the atoms are not distributed equally throughout the molecule, so that the hydrogen ends of water molecules have a slight positive charge, and the oxygen end has a slight negative charge, making water a polar molecule. The negative oxygen side of the molecule forms an attraction to the positive hydrogen end of a neighboring molecule. This rather weak force of attraction is called a hydrogen bond (Figure 5.1.1). If not for hydrogen bonds, water would vaporize at -68o C, meaning liquid water (and thus life) could not exist on Earth. These hydrogen bonds are responsible for some of water’s unique properties:
1. Water is the only substance to naturally exist in a solid, liquid, and gaseous form under the normal range of temperatures and pressures found on Earth. This is due to water’s relatively high freezing and vaporizing points (see below).
2. Water has a high heat capacity, which is the amount of heat that must be added to raise its temperature. Specific heat is the heat required to raise the temperature of 1 g of a substance by 1o C. Water has the highest specific heat of any liquid except ammonia (Table 5.1.1).
Table 5.1.1 Specific heat values for a number of common substances
| Specific Heat (calories/g/Co) | |
|---|---|
| Ammonia | 1.13 |
| Water | 1.00 |
| Acetone | 0.51 |
| Grain Alcohol | 0.23 |
| Aluminum | 0.22 |
| Copper | 0.09 |
| Silver | 0.06 |
Water is therefore one of the most difficult liquids to heat or cool; it can absorb large amounts of heat without increasing its temperature. Remember that temperature reflects the average kinetic energy of the molecules within a substance; the more vigorous the motion, the higher the temperature. In water, the molecules are held together by hydrogen bonds, and these bonds must be overcome to allow the molecules to move freely. When heat is added to water the energy must first go to breaking the hydrogen bonds before the temperature can begin to rise. Therefore, much of the added heat is absorbed by breaking H bonds, not by increasing the temperature, giving water a high heat capacity.
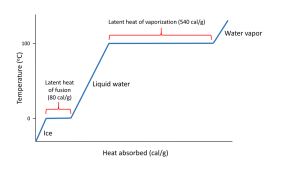
Hydrogen bonds also give water a high latent heat; the heat required to undergo a phase change from solid to liquid, or liquid to gas. The latent heat of fusion is the heat required to go from solid to liquid; 80 cal/g in the case of ice melting to water. Ice is a solid because hydrogen bonds hold the water molecules into a solid crystal lattice (see below). As ice is heated, the temperature rises up to 0o C. At that point, any additional heat goes to melting the ice by breaking the hydrogen bonds, not to increasing the temperature. So as long as ice is present, the water temperature will not increase. This is why your drink will remain cold as long as it contains ice; any heat absorbed goes to melting the ice, not to warming the drink.
When all of the ice is melted, additional heat will increase the temperature of the water 1o C for each calorie of heat added, until it reaches 100o C. At that point, any additional heat goes to overcoming the hydrogen bonds and turning the liquid water into water vapor, rather than increasing the water temperature. The heat required to evaporate liquid water into water vapor is the latent heat of vaporization which has a value of 540 cal/g (Figure 5.1.2).
The high heat capacity of water helps regulate global climate, as the oceans slowly absorb and release heat, preventing rapid swings in temperature (see section 8.1). It also means that aquatic organisms aren’t as subjected to the same rapid temperature changes as terrestrial organisms. A deep ocean organism may not experience more than a 0.5o C change in temperature over its entire life, while a terrestrial species may encounter changes of more than 20o C in a single day!
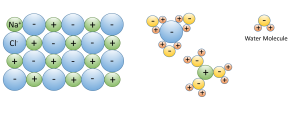
3. Water dissolves more substances than any other liquid; it is a “universal solvent”, which is why so many substances are dissolved in the ocean. Water is especially good at dissolving ionic salts; molecules made from oppositely charged ions such as NaCl (Na+ and Cl–). In water, the charged ions attract the polar water molecules. The ions get surrounded by a layer of water molecules, weakening the bond between the ions by up to 80 times. With the bonds weakened between ions, the substance dissolves (Figure 5.1.3).
4. The solid phase is less dense than the liquid phase. In other words, ice floats. Most substances are denser in the solid form than in the liquid form, as their molecules are more closely packed together as a solid. Water is an exception: the density of fresh water is 1.0 g/cm3, while the density of ice is 0.92 g/cm3, and once again, this is due to the action of hydrogen bonds.
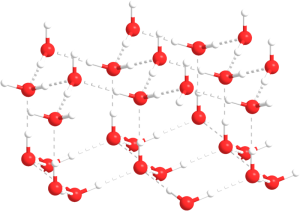
As water temperature cools the molecules slow down, eventually slowing enough that hydrogen bonds can form and hold the water molecules in a crystal lattice. The molecules in the lattice are spaced farther apart than the molecules in liquid water, which makes ice less dense than liquid water (Figure 5.1.4). This is familiar to anyone who has ever left a full water bottle in the freezer, only to have it burst as the water freezes and expands.
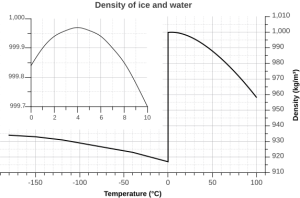
But the relationship between temperature and water density is not a simple linear one. As water cools, its density increases as expected, as the water molecules slow down and get closer together. However, fresh water reaches its maximum density at a temperature of 4o C, and as it cools beyond that point its density declines as the hydrogen bonds begin to form and the intermolecular spacing increases (Figure 5.1.5 inset). The density continues to decline until the temperature reaches 0o C and ice crystals form, reducing the density dramatically (Figure 5.1.5).
There are a number of important implications to ice being less dense than water. Ice floating on the surface of the ocean helps regulate ocean temperatures, and therefore global climate, by influencing the amount of sunlight that is reflected rather than absorbed (see section 5.6). On a smaller scale, surface ice can prevent lakes and ponds from freezing solid during the winter. As fresh surface water cools, the water gets denser, and sinks to the bottom. The new surface water then cools and sinks, and the process is repeated in what is referred to as overturning, with denser water sinking and less dense water moving to the surface only to be cooled and sink itself. In this way, the entire body of water is cooled somewhat evenly. This process continues until the surface water cools below 4o C. Below 4o C, the water becomes less dense as it cools, so it no longer sinks. Instead, it remains as the surface, getting colder and less dense, until it freezes at 0o C. Once fresh water freezes, the ice floats and insulates the rest of the water beneath it, reducing further cooling. The densest bottom water is still at 4o C, so it does not freeze, allowing the bottom of a lake or pond to remain unfrozen (which is good news for the animals living there) no matter how cold it gets outside.
The dissolved salts in seawater inhibit the formation of the crystal lattice, and therefore make it harder for ice to form. So seawater has a freezing point of about -2o C (depending on salinity), and freezes before a temperature of maximum density is reached. Thus seawater will continue to sink as it gets colder, until it finally freezes.
5. Water has a very high surface tension, the highest of any liquid except mercury (Table 5.1.2). Water molecules are attracted to each other by hydrogen bonds. For molecules not at the water surface, they are surrounded by other water molecules in all directions, so the attractive forces are evenly distributed in all directions. But for molecules at the surface there are few adjacent molecules above them, only below, so all of the attractive forces are directed inwards, away from the surface (Figure 5.1.6). This inwards force is what causes water droplets to take on a spherical shape, and water to bead up on a surface, as the spherical shape provides the minimum possible surface area. These attractive forces also cause the surface of the water to act like an elastic “skin” which allows things like insects to sit on the water’s surface without sinking.
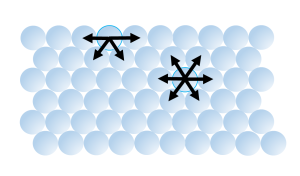
Table 5.1.2 Surface tensions of various liquids
| Liquid | Surface Tension (millinewton/meter) | Temperature oC |
|---|---|---|
| Mercury | 487.00 | 15 |
| Water | 71.97 | 25 |
| Glycerol | 63.00 | 20 |
| Acetone | 23.70 | 20 |
| Ethanol | 22.27 | 20 |
By Paul Webb, used under a CC-BY 4.0 international license. Download this book for free at https://rwu.pressbooks.pub/webboceanography/front-matter/preface/
Our modern understanding of tide formation stems from Isaac Newton's Law of Universal Gravitation, which states that any two objects have a gravitational attraction to each other. The magnitude of the force is proportional to the masses of the objects, and inversely proportional to the square of the distance between the objects, according to the equation in Figure 3.5.1.
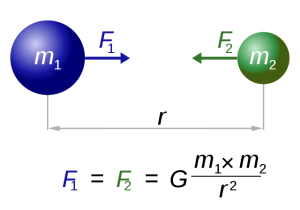
In the case of tides, there are a few other factors that modify this equation so that the distance (r) is cubed rather than squared, giving distance an even greater impact on tidal forces. But for our purposes, the important lesson is that the greater the masses of the objects, the greater the gravitational force, and the farther the objects are from each other, the weaker the force.
Such a gravitational force exists between the Earth and moon, attempting to pull them towards each other. Since the water covering Earth is fluid (unlike the solid land that is more resistant to tidal forces), this gravitational force pulls water towards the moon, creating a "bulge" of water on the side of the Earth facing the moon (Figure 3.5.2). This bulge always faces the moon, while the Earth rotates through it; the regions of Earth moving through the bulge experience a high tide, while those parts of the Earth away from the bulge experience a low tide.

If the tides were this simple, everywhere on Earth would see one high tide per day, as there would only be a bulge of water on the side closest to the moon. However, if you have ever looked at tide charts, or lived near the ocean, you probably know that in most places there are two high tides and two low tides per day. Where is this second high tide "bulge" coming from?
The gravitational force between the Earth and moon might be expected to draw the two objects closer together, however, this is not happening. This is because the inward gravitational force is opposed by outward forces that keep the Earth and moon apart. The outward force is an intertial force created by the rotation of the Earth and moon. Contrary to popular belief, the moon is not simply rotating around the Earth; in fact, the Earth and moon are both rotating around each other. Imagine the Earth and moon as equal-sized objects revolving around a point at their center of mass. If both objects had the same mass, the center of rotation would be a point equidistant between the two objects. But since the mass of the Earth is 82 times greater than the mass of the moon, the center of revolution must be closer to the Earth. As an analogy, think about two people on a see-saw. If the people are of roughly equal size, they can sit on either end of the see-saw at it will rotate around a point at equal distance between them. But if the two people have very different masses, such as a large adult and a small child, the larger person must move closer to the pivot point for the see-saw to rotate effectively. In the same way, the center of rotation between the Earth and the moon (the barycenter) must be located closer to the Earth. In fact, the center of rotation lies within the Earth, about 1600 km below the surface. As the Earth and moon rotate around the barycenter, the moon travels much farther than the Earth, giving the impression that the moon is rotating around Earth (Figure 3.5.3).

The rotation of the Earth-moon system creates an outward inertial force, which balances the gravitational force to keep the two bodies in their orbits. The inertial force has the same magnitude everywhere on Earth, and is always directed away from the moon. Gravitational force, on the other hand, is always directed towards the moon, and is stronger on the side of the Earth closest to the moon. Figure 3.5.4 describes how these forces combine to create the tidal forces. At point O in the center of the Earth, the gravitational force (Fg) and the inertial force (Fr) are equal, and cancel each other out. On the side of Earth closest to the moon, the inward gravitational force (Fg) is greater than the outward inertial force (Fr); the net resulting force (A) is directed towards the moon, and creates a bulge of water on the side facing the moon. On the side of Earth opposite the moon, the outward inertial force is greater than the inward gravitational force; the net resulting force (C) is directed away from the moon, creating a water bulge directed away from the moon.
Now, as the Earth rotates through a 24 hour day, each region passes through two bulges, and experiences two high tides and two low tides per day. This represents Newton's Equilibrium Theory of Tides, where there are two high tides and two low tides per day, of similar heights, each six hours apart. But as with everything else in oceanography, reality is much more complex than this idealized situation.

Some of the additional complexity is because in addition to the moon, the sun also exerts tide-affecting forces on Earth. The solar gravitational and inertial forces arise for the same reasons described above for the moon, but the magnitudes of the forces are different. The sun is 27 million times more massive than the moon, but it is 387 times farther away from the Earth. Despite its larger mass, because the sun is so much farther away than the moon, the sun's gravitational forces are only about half as strong as the moon's (remember that distance is cubed in the gravity equation). The sun thus creates its own, smaller water bulges, independent of the moon's, that contribute to the creation of tides.
When the sun, Earth and moon are aligned, as occurs during new and full moons, the solar and lunar bulges are also aligned, and add to each other (constructive interference; see section 4.2) creating an especially high tidal range; high high tides and low low tides (Figure 3.5.5). This period of maximum tidal range is called a spring tide, and they occur every two weeks.

When the sun, Earth and moon are at 90o to each other, the solar and lunar bulges are out of phase, and cancel each other out (destructive interference). Now the tidal range is small, with low high tides and high low tides (Figure 3.5.6). These are neap tides, and occur every two weeks, when the moon is in its 1/4 and 3/4 phases (Figure 3.5.7).


By Paul Webb, used under a CC-BY 4.0 international license. Download this book for free at https://rwu.pressbooks.pub/webboceanography/front-matter/preface/
The most obvious feature of the oceans is that they contain water. Water is so ubiquitous that it may not seem like a very interesting substance, but it has many unique properties that impact global oceanographic and climatological processes. Many of these processes are due to hydrogen bonds forming between water molecules.

The water molecule consists of two hydrogen atoms and one oxygen atom. The electrons responsible for the bonds between the atoms are not distributed equally throughout the molecule, so that the hydrogen ends of water molecules have a slight positive charge, and the oxygen end has a slight negative charge, making water a polar molecule. The negative oxygen side of the molecule forms an attraction to the positive hydrogen end of a neighboring molecule. This rather weak force of attraction is called a hydrogen bond (Figure 5.1.1). If not for hydrogen bonds, water would vaporize at -68o C, meaning liquid water (and thus life) could not exist on Earth. These hydrogen bonds are responsible for some of water’s unique properties:
1. Water is the only substance to naturally exist in a solid, liquid, and gaseous form under the normal range of temperatures and pressures found on Earth. This is due to water’s relatively high freezing and vaporizing points (see below).
2. Water has a high heat capacity, which is the amount of heat that must be added to raise its temperature. Specific heat is the heat required to raise the temperature of 1 g of a substance by 1o C. Water has the highest specific heat of any liquid except ammonia (Table 5.1.1).
Table 5.1.1 Specific heat values for a number of common substances
| Specific Heat (calories/g/Co) | |
|---|---|
| Ammonia | 1.13 |
| Water | 1.00 |
| Acetone | 0.51 |
| Grain Alcohol | 0.23 |
| Aluminum | 0.22 |
| Copper | 0.09 |
| Silver | 0.06 |
Water is therefore one of the most difficult liquids to heat or cool; it can absorb large amounts of heat without increasing its temperature. Remember that temperature reflects the average kinetic energy of the molecules within a substance; the more vigorous the motion, the higher the temperature. In water, the molecules are held together by hydrogen bonds, and these bonds must be overcome to allow the molecules to move freely. When heat is added to water the energy must first go to breaking the hydrogen bonds before the temperature can begin to rise. Therefore, much of the added heat is absorbed by breaking H bonds, not by increasing the temperature, giving water a high heat capacity.
Hydrogen bonds also give water a high latent heat; the heat required to undergo a phase change from solid to liquid, or liquid to gas. The latent heat of fusion is the heat required to go from solid to liquid; 80 cal/g in the case of ice melting to water. Ice is a solid because hydrogen bonds hold the water molecules into a solid crystal lattice (see below). As ice is heated, the temperature rises up to 0o C. At that point, any additional heat goes to melting the ice by breaking the hydrogen bonds, not to increasing the temperature. So as long as ice is present, the water temperature will not increase. This is why your drink will remain cold as long as it contains ice; any heat absorbed goes to melting the ice, not to warming the drink.
When all of the ice is melted, additional heat will increase the temperature of the water 1o C for each calorie of heat added, until it reaches 100o C. At that point, any additional heat goes to overcoming the hydrogen bonds and turning the liquid water into water vapor, rather than increasing the water temperature. The heat required to evaporate liquid water into water vapor is the latent heat of vaporization which has a value of 540 cal/g (Figure 5.1.2).

The high heat capacity of water helps regulate global climate, as the oceans slowly absorb and release heat, preventing rapid swings in temperature (see section 8.1). It also means that aquatic organisms aren't as subjected to the same rapid temperature changes as terrestrial organisms. A deep ocean organism may not experience more than a 0.5o C change in temperature over its entire life, while a terrestrial species may encounter changes of more than 20o C in a single day!
3. Water dissolves more substances than any other liquid; it is a "universal solvent", which is why so many substances are dissolved in the ocean. Water is especially good at dissolving ionic salts; molecules made from oppositely charged ions such as NaCl (Na+ and Cl-). In water, the charged ions attract the polar water molecules. The ions get surrounded by a layer of water molecules, weakening the bond between the ions by up to 80 times. With the bonds weakened between ions, the substance dissolves (Figure 5.1.3).

4. The solid phase is less dense than the liquid phase. In other words, ice floats. Most substances are denser in the solid form than in the liquid form, as their molecules are more closely packed together as a solid. Water is an exception: the density of fresh water is 1.0 g/cm3, while the density of ice is 0.92 g/cm3, and once again, this is due to the action of hydrogen bonds.
As water temperature cools the molecules slow down, eventually slowing enough that hydrogen bonds can form and hold the water molecules in a crystal lattice. The molecules in the lattice are spaced farther apart than the molecules in liquid water, which makes ice less dense than liquid water (Figure 5.1.4). This is familiar to anyone who has ever left a full water bottle in the freezer, only to have it burst as the water freezes and expands.

But the relationship between temperature and water density is not a simple linear one. As water cools, its density increases as expected, as the water molecules slow down and get closer together. However, fresh water reaches its maximum density at a temperature of 4o C, and as it cools beyond that point its density declines as the hydrogen bonds begin to form and the intermolecular spacing increases (Figure 5.1.5 inset). The density continues to decline until the temperature reaches 0o C and ice crystals form, reducing the density dramatically (Figure 5.1.5).

There are a number of important implications to ice being less dense than water. Ice floating on the surface of the ocean helps regulate ocean temperatures, and therefore global climate, by influencing the amount of sunlight that is reflected rather than absorbed (see section 5.6). On a smaller scale, surface ice can prevent lakes and ponds from freezing solid during the winter. As fresh surface water cools, the water gets denser, and sinks to the bottom. The new surface water then cools and sinks, and the process is repeated in what is referred to as overturning, with denser water sinking and less dense water moving to the surface only to be cooled and sink itself. In this way, the entire body of water is cooled somewhat evenly. This process continues until the surface water cools below 4o C. Below 4o C, the water becomes less dense as it cools, so it no longer sinks. Instead, it remains as the surface, getting colder and less dense, until it freezes at 0o C. Once fresh water freezes, the ice floats and insulates the rest of the water beneath it, reducing further cooling. The densest bottom water is still at 4o C, so it does not freeze, allowing the bottom of a lake or pond to remain unfrozen (which is good news for the animals living there) no matter how cold it gets outside.
The dissolved salts in seawater inhibit the formation of the crystal lattice, and therefore make it harder for ice to form. So seawater has a freezing point of about -2o C (depending on salinity), and freezes before a temperature of maximum density is reached. Thus seawater will continue to sink as it gets colder, until it finally freezes.
5. Water has a very high surface tension, the highest of any liquid except mercury (Table 5.1.2). Water molecules are attracted to each other by hydrogen bonds. For molecules not at the water surface, they are surrounded by other water molecules in all directions, so the attractive forces are evenly distributed in all directions. But for molecules at the surface there are few adjacent molecules above them, only below, so all of the attractive forces are directed inwards, away from the surface (Figure 5.1.6). This inwards force is what causes water droplets to take on a spherical shape, and water to bead up on a surface, as the spherical shape provides the minimum possible surface area. These attractive forces also cause the surface of the water to act like an elastic "skin" which allows things like insects to sit on the water's surface without sinking.

Table 5.1.2 Surface tensions of various liquids
| Liquid | Surface Tension (millinewton/meter) | Temperature oC |
|---|---|---|
| Mercury | 487.00 | 15 |
| Water | 71.97 | 25 |
| Glycerol | 63.00 | 20 |
| Acetone | 23.70 | 20 |
| Ethanol | 22.27 | 20 |
By Paul Webb, used under a CC-BY 4.0 international license. Download this book for free at https://rwu.pressbooks.pub/webboceanography/front-matter/preface/
Tsunamis loom large in popular culture, but there are a number of misconceptions about these large waves. First, tsunamis have nothing to do with the tides, so it is a misnomer to refer to them as "tidal waves." There are actual tidal waves (see section 3.5), but they are not related to tsunamis. Second, the giant, curling wave that is taller than skyscrapers and destroys cities in science fiction movies is also a fabrication, as tsunamis do not behave that way, as described below.
Tsunamis are large waves that are usually the result of seismic activity, such as the rising or falling of the seafloor due to earthquakes, although volcanic activity and landslides can also cause tsunamis in the form of splash waves (see section 3.1). As the seafloor rises or falls, so does the water column above it, creating waves. Only vertical seismic disturbances cause tsunamis, not horizontal movements. These vertical seafloor movements are usually less than 10 m high, so the resulting wave will be of an equal or lesser height at sea. While the tsunamis have a relatively small height at the point of origin, they have very long wavelengths (100-200 km). Because of the long wavelength, they behave as shallow water waves throughout the entire ocean; the depth of the ocean is always shallower than half of their wavelength. As shallow water waves, their speed depends on water depth, but they can still travel at speeds over 750 km/hr (Figure 3.4.1)!
When tsunamis approach land, they behave just like any other wave; as the depth becomes shallower, the waves slow down and the wave height begins to increase. However, contrary to popular belief, tsunamis do not arrive on shore as giant, cresting waves. Since their wavelength is so long, it is impossible for their height to ever exceed 1/7 of their wavelength, so the waves don’t actually curl or break. Instead, they usually hit the shore as sudden surges of water causing a very rapid increase in sea level, like that of an enormous rise in tide. It may take several minutes for the wave to pass, during which time sea level can rise to 40 m higher than usual.
Large tsunamis occur every 2-3 years, with very large, damaging events happening every 15-20 years. The most devastating tsunami in terms of loss of life resulted from a magnitude 9 earthquake in Indonesia in 2004 (Figure 3.4.2), which created waves up to 33 m tall and left about 230,000 people dead in Indonesia, Thailand, and Sri Lanka. In 2011 a 9.0 magnitude earthquake in Japan triggered a tsunami up to 40.5 m high, which resulted in over 18,000 deaths. This earthquake also caused the Fukishima nuclear accident, and moved Japan about 8 inches closer to the U.S.

By Paul Webb, used under a CC-BY 4.0 international license. Download this book for free at https://rwu.pressbooks.pub/webboceanography/front-matter/preface/
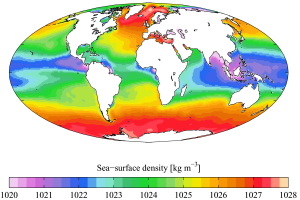
Density refers to the amount of mass per unit volume, such as grams per cubic centimeter (g/cm3). The density of fresh water is 1 g/cm3 at 4o C (see section 5.1), but the addition of salts and other dissolved substances increases surface seawater density to between 1.02 and 1.03 g/cm3. The density of seawater can be increased by reducing its temperature, increasing its salinity, or increasing the pressure. Pressure has the least impact on density as water is fairly incompressible, so pressure effects are not very significant except at extreme depths. However, if not for the slight compression of water due to pressure, sea level would be approximately 50 m higher than it is today! That leaves temperature and salinity as the primary factors determining density, and of these, temperature has the greatest impact (Figure 5.7.1).
Since temperature has the greatest effect on density, density profiles are usually mirror images of temperature profiles (Figure 5.7.2). Density is lowest at the surface, where the water is the warmest. As depth increases, there is a region of rapidly increasing density with increasing depth, which is called the pycnocline. The pycnocline coincides with the thermocline, as it is the sudden decrease in temperature that leads to the increase in density. Below the pycnocline, density may be fairly constant (as is temperature), or it may continue to increase slightly towards the bottom.
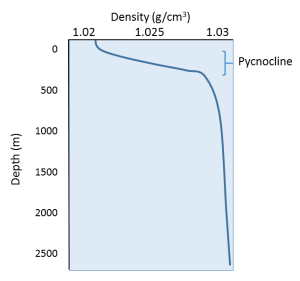
The profile above represents a stable state, or a high degree of stratification, where the warm, low density layer sits atop the colder, denser layer. If denser water happened to form at the surface, the water masses would be unstable, and the denser water would sink to the bottom, to be replaced by less dense water at the surface. This vertical movement of water masses based on density (as determined by temperature and salinity) is referred to as thermohaline circulation, which is the topic of section 7.8. By creating a stratified water column, the thermocline and pycnocline together create a barrier that prevents mixing between the warmer, less dense surface water and the colder, denser bottom water. In this way, nutrient-rich deep water may be prevented from coming to the surface to support primary production.
As with temperature, there are also latitudinal differences in density. In the tropics the surface water is warm and low density, and there is a pronounced thermocline separating it from the colder, denser deep water. As stated above, this stratification prevents nutrient-rich water from reaching the surface and as a result tropical regions often have low productivity. In the high latitudes the water is uniformly cold at all depths, so there is little density stratification. The lack of a pycnocline (or a thermocline) allows cold, nutrient-rich deep water to more easily mix with the surface water, leading to higher primary production in polar regions.
If one thing has been constant about Earth’s climate over geological time, it is its constant change. In the geological record, we can see this in the evidence of glaciations in the distant past, and we can also detect periods of extreme warmth by looking at the isotope composition of seafloor sediments. Not only has the climate changed frequently, the temperature fluctuations have been very significant. Today’s mean global temperature is about 15°C. However, during its coldest periods, the global mean was as cold as -50°C, while at various times during the Paleozoic and Mesozoic and during the Paleocene-Eocene thermal maximum, it was close to 30°C.
There are two parts to climate change, the first one is known as climate forcing, which is when conditions change to give the climate a little nudge in one direction or the other. The second part of climate change, and the one that typically does most of the work, is what we call a feedback. When a climate forcing changes the climate a little, a whole series of environmental changes take place, many of which either exaggerate the initial change (positive feedback), or suppress the change (negative feedback).
An example of a climate forcing mechanism is the increase in the amount of carbon dioxide (CO2) in the atmosphere that results from our use of fossil fuels. CO2 traps heat in the atmosphere and leads to climate warming. Warming changes vegetation patterns; contributes to the melting of snow, ice, and permafrost; causes sea level to rise; reduces the solubility of CO2 in sea water; and has a number of other minor effects. Most of these changes contribute to more warming. Melting of permafrost, for example, is a strong positive feedback because frozen soil contains trapped organic matter that is converted to CO2 and methane (CH4) when the soil thaws. Both these gases accumulate in the atmosphere and add to the warming effect. On the other hand, if warming causes more vegetation growth, that vegetation should absorb CO2, thus reducing the warming effect, which would be a negative feedback. Under our current conditions — a planet that still has lots of glacial ice and permafrost — most of the feedbacks that result from a warming climate are positive feedbacks and so the climate changes that we cause get naturally amplified by natural processes.
Natural Climate Forcing
Natural climate forcing has been going on throughout geological time. A wide range of processes has been operating at widely different time scales, from a few years to billions of years. The longest-term natural forcing variation is related to the evolution of the Sun. Like most other stars of a similar mass, our Sun is evolving. For the past 4.6 billion years, its rate of nuclear fusion has been increasing, and it is now emitting about 40% more energy (as light) than it did at the beginning of geological time. A difference of 40% is big, so it’s a little surprising that the temperature on Earth has remained at a reasonable and habitable temperature for all of this time. The mechanism for that relative climate stability has been the evolution of our atmosphere from one that was dominated by CO2, and also had significant levels of CH4 — both greenhouse gasses — to one with only a few hundred parts per million of CO2 and just under 1 part per million of CH4. Those changes to our atmosphere have been no accident; over geological time, life and its metabolic processes have evolved (such as the evolution of photosynthetic bacteria that consume CO2) and changed the atmosphere to conditions that remained cool enough to be habitable.
The position of the Earth relative to the Sun is another important component of natural climate forcing. Earth’s orbit around the Sun is nearly circular, but like all physical systems, it has natural oscillations. First, the shape of the orbit changes on a regular time scale (close to 100,000 years) from being close to circular to being very slightly elliptical. But the circularity of the orbit is not what matters; it is the fact that as the orbit becomes more elliptical, the position of the Sun within that ellipse becomes less central or more eccentric (Figure 6.5.1a). Eccentricity is important because when it is high, the Earth-Sun distance varies more from season to season than it does when eccentricity is low.
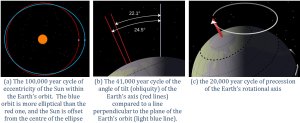
Second, Earth rotates around an axis through the North and South Poles, and that axis is at an angle to the plane of Earth’s orbit around the Sun (Figure 6.5.1b). The angle of tilt (also known as obliquity) varies on a time scale of 41,000 years. When the angle is at its maximum (24.5°), Earth’s seasonal differences are accentuated. When the angle is at its minimum (22.1°), seasonal differences are minimized. The current hypothesis is that glaciation is favored at low seasonal differences as summers would be cooler and snow would be less likely to melt and more likely to accumulate from year to year. Third, the direction in which Earth’s rotational axis points also varies, on a time scale of about 20,000 years (Figure 6.5.1c). This variation, known as precession, means that although the North Pole is presently pointing to the star Polaris (the pole star), in 10,000 years it will point to the star Vega. The importance of eccentricity, tilt, and precession to Earth’s climate cycles (now known as Milankovitch Cycles) was first pointed out by Yugoslavian engineer and mathematician Milutin Milankovitch in the early 1900s. Milankovitch recognized that although the variations in the orbital cycles did not affect the total amount of insolation (light energy from the Sun) that Earth received, it did affect where on Earth that energy was strongest.
Volcanic eruptions don’t just involve lava flows and exploding rock fragments; various particulates and gases are also released, the important ones being sulphur dioxide and CO2. Sulphur dioxide is an aerosol that reflects incoming solar radiation and has a net cooling effect that is short lived (a few years in most cases, as the particulates settle out of the atmosphere within a couple of years), and doesn’t typically contribute to longer-term climate change. Volcanic CO2 emissions can contribute to climate warming but only if a greater-than-average level of volcanism is sustained over a long time (at least tens of thousands of years). It is widely believed that the catastrophic end-Permian extinction (at 250 Ma) resulted from warming initiated by the eruption of the massive Siberian Traps over a period of at least a million years.
Ocean currents are important to climate, and currents also have a tendency to oscillate. Glacial ice cores show clear evidence of changes in the Gulf Stream that affected global climate on a time scale of about 1,500 years during the last glaciation. The east-west changes in sea-surface temperature and surface pressure in the equatorial Pacific Ocean, known as the El Niño Southern Oscillation or ENSO varies on a much shorter time scale of between two and seven years. These variations tend to garner the attention of the public because they have significant climate implications in many parts of the world. The strongest El Niños in recent decades were in 1983, 1998, and 2015 and those were very warm years from a global perspective. During a strong El Niño, the equatorial Pacific sea-surface temperatures are warmer than normal and heat the atmosphere above the ocean, which leads to warmer-than-average global temperatures.
Climate Feedbacks
As already stated, climate feedbacks are critically important in amplifying weak climate forcings into full-blown climate changes. Since Earth still has a very large volume of ice, mostly in the continental ice sheets of Antarctica and Greenland, but also in alpine glaciers and permafrost, melting is one of the key feedback mechanisms. Melting of ice and snow leads to several different types of feedbacks, an important one being a change in albedo, or the reflectivity of a surface. Earth’s various surfaces have widely differing albedos, expressed as the percentage of light that reflects off a given material. This is important because most solar energy that hits a very reflective surface is not absorbed and therefore does little to warm Earth. Water in the oceans or on a lake is one of the darkest surfaces, reflecting less than 10% of the incident light, while clouds and snow or ice are among the brightest surfaces, reflecting 70% to 90% of the incident light. When sea ice melts, as it has done in the Arctic Ocean at a disturbing rate over the past decade, the albedo of the area affected changes dramatically, from around 80% down to less than 10%. Much more solar energy is absorbed by the water than by the pre-existing ice, and the temperature increase is amplified. The same applies to ice and snow on land, but the difference in albedo is not as great. When ice and snow on land melt, sea level rises. (Sea level is also rising because the oceans are warming and that increases their volume). A higher sea level means a larger proportion of the planet is covered with water, and since water has a lower albedo than land, more heat is absorbed and the temperature goes up a little more. Since the last glaciation, sea-level rise has been about 125 m; a huge area that used to be land is now flooded by heat-absorbent seawater. During the current period of anthropogenic climate change, sea level has risen only about 20 cm, and although that doesn’t make a big change to albedo, sea-level rise is accelerating.
Most of northern Canada, Alaska, Russia, and Scandinavia has a layer of permafrost that ranges from a few centimeters to hundreds of meters in thickness. Permafrost is a mixture of soil and ice and it also contains a significant amount of trapped organic carbon that is released as CO2 and CH4 when the permafrost breaks down. Because the amount of carbon stored in permafrost is in the same order of magnitude as the amount released by burning fossil fuels, this is a feedback mechanism that has the potential to equal or surpass the forcing that has unleashed it. In some polar regions, including northern Canada, permafrost includes methane hydrate, a highly concentrated form of CH4 trapped in solid form. Breakdown of permafrost releases this CH4. Even larger reserves of methane hydrate exist on the seafloor, and while it would take significant warming of ocean water down to a depth of hundreds of meters, this too is likely to happen in the future if we don’t limit our impact on the climate. There is strong isotopic evidence that the Paleocene-Eocene thermal maximum was caused, at least in part, by a massive release of sea-floor methane hydrate.
There is about 45 times as much carbon in the ocean (as dissolved bicarbonate ions, HCO3-) as there is in the atmosphere (as CO2), and there is a steady exchange of carbon between the two reservoirs (see section 5.5). But the solubility of CO2 in water decreases as the temperature goes up. In other words, the warmer it gets, the more oceanic bicarbonate that gets transferred to the atmosphere as CO2. That makes CO2 solubility another positive feedback mechanism. Vegetation growth responds positively to both increased temperatures and elevated CO2 levels, and so in general, it represents a negative feedback to climate change because the more the vegetation grows, the more CO2 is taken from the atmosphere. But it’s not quite that simple, because when trees grow bigger and more vigorously, forests become darker (they have lower albedo) so they absorb more heat. Furthermore, climate warming isn’t necessarily good for vegetation growth; some areas have become too hot, too dry, or even too wet to support the plant community that was growing there, and it might take centuries for something to replace it successfully. All of these positive (and negative) feedbacks work both ways. For example, during climate cooling, growth of glaciers leads to higher albedos, and formation of permafrost results in storage of carbon that would otherwise have returned quickly to the atmosphere.
Anthropogenic Climate Change
When we talk about anthropogenic climate change, we are generally thinking of the industrial era, which really got going when we started using fossil fuels (coal to begin with, and later oil and natural gas) to drive machinery and trains, and to generate electricity. That was around the middle of the 18th century. The issue with fossil fuels is that they involve burning carbon that was naturally stored in the crust over hundreds of millions of years as part of Earth’s process of counteracting the warming Sun.
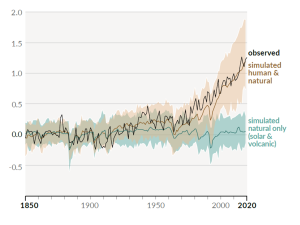
A rapidly rising population, the escalating level of industrialization and mechanization of our lives, and an increasing dependence on fossil fuels have driven the anthropogenic climate change of the past century. The trend of mean global temperatures since 1850 is shown in Figure 6.5.2. For approximately the past 55 years, the temperature has increased at a relatively steady and disturbingly rapid rate, especially compared to past changes. The average temperature now is approximately 1.1°C higher than before industrialization, and two-thirds of this warming has occurred since 1975.
The Intergovernmental Panel on Climate Change (IPCC), established by the United Nations in 1988, is responsible for reviewing the scientific literature on climate change and issuing periodic reports on several topics, including the scientific basis for understanding climate change, our vulnerability to observed and predicted climate changes, and what we can do to limit climate change and minimize its impacts. Figure 6.5.3, from the sixth report of the IPCC, issued in preliminary form in 2021, shows the relative contributions of various greenhouse gases and other factors to current climate forcing, based on the changes from levels that existed in 1750.
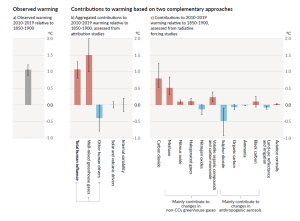
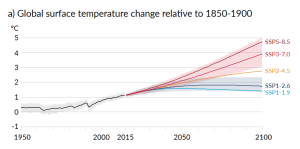
The biggest anthropogenic contributor to warming is the emission of CO2, which accounts for 50% of positive forcing. CH4 and its atmospheric derivatives (CO2, H2O, and O3) account for 29%, and the halocarbon gases (mostly leaked from air-conditioning appliances) and nitrous oxide (N2O) (from burning fossils fuels) account for 5% each. Carbon monoxide (CO) (also produced by burning fossil fuels) accounts for 7%, and the volatile organic compounds other than methane (NMVOC) account for 3%. CO2 emissions come mostly from coal- and gas-fired power stations, motorized vehicles (cars, trucks, and aircraft), and industrial operations (e.g., smelting), and indirectly from forestry. CH4 emissions come from production of fossil fuels (escape from coal mining and from gas and oil production), livestock farming (mostly beef), landfills, and wetland rice farming. N2O and CO come mostly from the combustion of fossil fuels. In summary, close to 70% of our current greenhouse gas emissions come from fossil fuel production and use, while most of the rest comes from agriculture and landfills. Figure 6.5.4 shows the IPCC’s projections for temperature increases over the next 100 years as a result of these increasing greenhouse gases.
Impacts of Climate Change
We’ve all experienced the effects of climate change over the past decade. However, it’s not straightforward for climatologists to make the connection between a warming climate and specific weather events, and most are justifiably reluctant to ascribe any specific event to climate change. In this respect, the best measures of climate change are those that we can detect over several decades, such as the temperature changes shown in Figure 6.5.2, or the sea level rise shown in Figure 6.5.5. As already stated, sea level has risen approximately 20 cm since 1750, and that rise is attributed to both warming (and therefore expanding) seawater and melting glaciers and other land-based snow and ice (melting of sea ice does not contribute directly to sea level rise as it is already floating in the ocean).
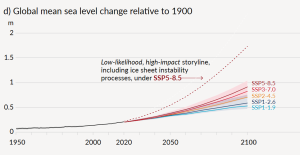
Projections for sea level rise to the end of this century vary widely. This is in large part because we do not know which of the above climate change scenarios (Figure 6.5.4) we will most closely follow, but many are in the range from 0.5 m to 2.0 m. One of the problems in predicting sea level rise is that we do not have a strong understanding of how large ice sheets, such as Greenland and Antarctica, will respond to future warming. Another issue is that the oceans don’t respond immediately to warming. For example, with the current amount of warming, we are already committed to a future sea level rise of between 1.3 m and 1.9 m, even if we could stop climate change today. This is because it takes decades to centuries for the existing warming of the atmosphere to be transmitted to depth within the oceans and to exert its full impact on large glaciers. Most of that committed rise would take place over the next century, but some would be delayed longer. And for every decade that the current rates of climate change continue, that number increases by another 0.3 m. In other words, if we don’t make changes quickly, by the end of this century we’ll be locked into 3 m of future sea level rise. In a 2008 report, the Organization for Economic Co-operation and Development (OECD) estimated that by 2070 approximately 150 million people living in coastal areas could be at risk of flooding due to the combined effects of sea level rise, increased storm intensity, and land subsidence. The assets at risk (buildings, roads, bridges, ports, etc.) are in the order of $35 trillion ($35,000,000,000,000). Countries with the greatest exposure of population to flooding are China, India, Bangladesh, Vietnam, U.S.A., Japan, and Thailand. Some of the major cities at risk include Shanghai, Guangzhou, Mumbai, Kolkata, Dhaka, Ho Chi Minh City, Tokyo, Miami, and New York.
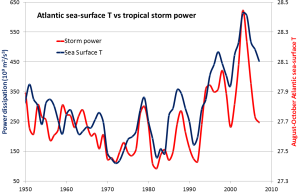
One of the other risks for coastal populations, besides sea level rise, is that climate warming is also associated with an increase in the intensity of tropical storms (e.g., hurricanes or typhoons; see section 6.4), which almost always bring serious flooding from intense rain and storm surges. Some recent examples are New Orleans in 2005 with Hurricane Katrina, and New Jersey and New York in 2012 with Hurricane Sandy. Tropical storms get their energy from the evaporation of warm seawater in tropical regions. In the Atlantic Ocean, this takes place between 8° and 20° N in the summer. Figure 6.5.6 shows the variations in the sea-surface temperature (SST) of the tropical Atlantic Ocean (in blue) versus the amount of power represented by Atlantic hurricanes between 1950 and 2008 (in red). Not only has the overall intensity of Atlantic hurricanes increased with the warming since 1975, but the correlation between hurricanes and sea-surface temperatures is very strong over that time period.
The geographical ranges of diseases and pests, especially those caused or transmitted by insects, have been shown to extend toward temperate regions because of climate change. West Nile virus and Lyme disease are two examples that already directly affect North Americans, while dengue fever could be an issue in the future (dengue became a "nationally notifiable condition" in the United States in 2010). For several weeks in July and August of 2010, a massive heat wave affected western Russia, especially the area southeast of Moscow, and scientists have stated that climate change was a contributing factor. Temperatures soared to over 40°C, as much as 12°C above normal over a wide area, and wildfires raged in many parts of the country. Over 55,000 deaths are attributed to the heat and to respiratory problems associated with the fires. A summary of the impacts of climate change on natural disasters is given in Figure 6.5.7. The major types of disasters related to climate are floods and storms, but the health implications of extreme temperatures are also becoming a great concern. In the decade 1971 to 1980, extreme temperatures were the fifth most common natural disasters; by 2001 to 2010, they were the third most common.

With so many variables playing a role in the production of tides, it is understandable that not every place on Earth will experience exactly the same tidal conditions. There are three primary classifications for tides, depending on the number and relative heights of tidal cycles per day.
A diurnal tide consists of only one high tide and one low tide per day (Figure 3.7.1). "Diurnal" refers to a daily occurrence, so a situation where there is only one complete tidal cycle per day is considered a diurnal tide. Diurnal tides are common in the Gulf of Mexico, along the west coast of Alaska, and in parts of Southeast Asia.
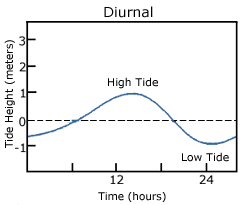
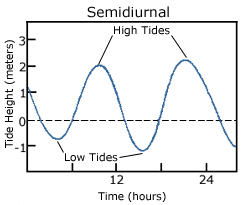
A semidiurnal tide exhibits two high and two low tides each day, with both highs and both lows of toughly equal height (Figure 3.7.2). "Semidiurnal" means "half of a day"; one tidal cycle takes half of a day, therefore there are two complete cycles per day. Semidiurnal tides are common along the east coasts of North America and Australia, the west coast of Africa, and most of Europe.
Mixed semidiurnal tides (or mixed tides), have two high tides and two low tides per day, but the heights of each tide differs; the two high tides are of different heights, as are the two low tides (Figure 3.7.3). The differences in height may be the result of amphidromic circulation, the angle of the moon, or any of the other variables discussed in section 3.6. Mixed semidiurnal tides are found along the Pacific coast of North America.

Figure 3.7.4 shows the distribution of the various tide types throughout the world.

Tidal Currents
The movement of water with the rising and falling tide creates tidal currents. As the tide rises, water flows into an area, creating a flood current. As the tide falls and water flows out an ebb current is created. Slack water, or slack tides occur during the transition between incoming high and outgoing low tides, when there is no net water movement.
The strength of a tidal current depends on the volume of water that enters and exits with each tidal cycle (the tidal volume or tidal prism), and the area through which the water flows. A large tidal volume moving through a large area may create only a weak tidal current, as the volume is spread over a wide area. On the other hand, a narrow area may produce a strong tidal current even if the tidal volume is small, as all of the water is forced through a small area. It follows that the strongest tidal currents will result from a large tidal range moving through a narrow area.
Tidal bores occur where rivers meet the ocean. If the incoming tidal current is stronger than the river outflow, the tidal bore appears as a wave, or moving wall of water that moves up the river as the tide comes in (Figure 3.7.5).

In many cases these tidal bores may move through a river or inlet for many kilometers, and if they are large enough they can form continually breaking waves that surfers can ride much farther and longer than a traditional ocean wave, such as the Severn Bore in England, shown in the video below.
https://youtu.be/IKA39LQOIck
Additional links for more information
- For an even more dramatic tidal bore, watch this video of the "Silver Dragon" on China's Qiantang River
By Paul Webb, used under a CC-BY 4.0 international license. Download this book for free at https://rwu.pressbooks.pub/webboceanography/front-matter/preface/
Estuaries are partially enclosed bodies of water where the salt water is diluted by fresh water input from land, creating brackish water with a salinity somewhere between fresh water and normal seawater. Estuaries include many bays, inlets, and sounds, and are often subject to large temperature and salinity variations due to their enclosed nature and smaller size compared to the open ocean.
Estuaries can be classified geologically into four basic categories based on their method of origin. In all cases they are a result of rising sea level over the last 18,000 years, beginning with the end of the last ice age; a period that has seen a rise of about 130 m. The rise in sea level has flooded coastal areas that were previously above water, and prevented the estuaries from being filled in by all of the sediments that have been emptied into them.
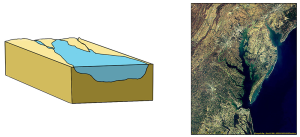
The first type is a coastal plain estuary, or drowned river valley. These estuaries are formed as sea level rises and floods an existing river valley, mixing salt and fresh water to create the brackish conditions where the river meets the sea. These types of estuaries are common along the east coast of the United States, including major bodies such as the Chesapeake Bay, Delaware Bay, and Narragansett Bay (Figure 4.6.1). Coastal plain estuaries are usually shallow, and since there is a lot of sediment input from the rivers, there are often a number of depositional features associated with them such as spits and barrier islands.
The presence of sand bars, spits, and barrier islands can lead to bar-built estuaries, where a barrier is created between the mainland and the ocean. The water that remains inside the sand bar is cut off from complete mixing with the ocean, and receives freshwater input from the mainland, creating estuarine conditions (Figure 4.6.2).

Fjords are estuaries formed in deep, U-shaped basins that were carved out by advancing glaciers. When the glaciers melted and retreated, sea level rose and filled these troughs, creating deep, steep-walled fjords (Figure 4.6.3). Fjords are common in Norway, Alaska, Canada, and New Zealand, where there are mountainous coastlines once covered by glaciers.

Tectonic estuaries are the result of tectonic movements, where faulting causes some sections of the crust to subside, and those lower elevation sections then get flooded with seawater. San Francisco Bay is an example of a tectonic estuary (Figure 4.6.4).

Estuaries are also classified based on their salinity and mixing patterns. The amount of mixing of fresh and salt water in an estuary depends on the rate at which fresh water enters the head of the estuary from river input, and the amount of seawater that enters the estuary mouth as a result of tidal movements. The input of fresh water is reflected in the flushing time of the estuary. This refers to the time it would take for the in-flowing fresh water to completely replace all the fresh water currently in the estuary. Seawater input is measured by the tidal volume, or tidal prism, which is the average volume of sea water entering and leaving the estuary during each tidal cycle. In other words, it is the volume difference between high and low tides. The interaction between the flushing time, tidal volume, and the shape of the estuary will determine the extent and type of water mixing within the estuary.
In a vertically mixed, or well-mixed estuary there is complete mixing of fresh and salt water from the surface to the bottom. In a particular location the salinity is constant at all depths, but across the estuary the salinity is lowest at the head where the fresh water enters, and is highest at the mouth, where the seawater comes in. This type of salinity profile usually occurs in shallower estuaries, where the shallow depths allow complete mixing from the surface to the bottom.

Slightly stratified or partially mixed estuaries have similar salinity profiles to vertically mixed estuaries, where salinity increases from the head to the mouth, but there is also a slight increase in salinity with depth at any point. This usually occurs in deeper estuaries than those that are well-mixed, where waves and currents mix the surface water, but the mixing may not extend all the way to the bottom.

A salt wedge estuary occurs where the outflow of fresh water is strong enough to prevent the denser ocean water to enter through the surface, and where the estuary is deep enough that surface waves and turbulence have little mixing effect on the deeper water. Fresh water flows out along surface, salt water flows in at depth, creating a wedge shaped lens of seawater moving along the bottom. The surface water may remain mostly fresh throughout the estuary if there is no mixing, or it can become brackish depending on the level of mixing that occurs.

Highly stratified profiles are found in very deep estuaries, such as in fjords. Because of the depth, mixing of fresh and salt water only occurs near the surface, so in the upper layers salinity increases from the head to the mouth, but the deeper water is of standard ocean salinity.

Estuaries are very important commercially, as they are home to the majority of the world’s metropolitan areas, they serve as ports for industrial activity, and a large percentage of the world's population lives near estuaries. Estuaries are also very important biologically, especially in their role as the breeding grounds for many species of fish, birds, and invertebrates.
By Paul Webb, used under a CC-BY 4.0 international license. Download this book for free at https://rwu.pressbooks.pub/webboceanography/front-matter/preface/

