11 2.5 Divergent Plate Boundaries
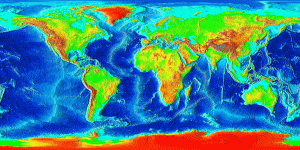
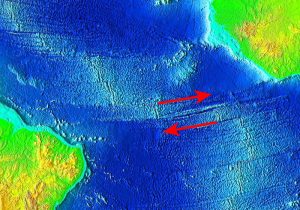
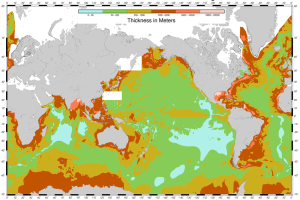
Divergent boundaries are spreading boundaries, where new oceanic crust is created to fill in the space as the plates move apart. Most divergent boundaries are located along mid-ocean oceanic ridges (although some are on land). The mid-ocean ridge system is a giant undersea mountain range, and is the largest geological feature on Earth; at 65,000 km long and about 1000 km wide, it covers 23% of Earth’s surface (Figure 2.5.1). Because the new crust formed at the plate boundary is warmer than the surrounding crust, it has a lower density so it sits higher on the mantle, creating the mountain chain. Running down the middle of the mid-ocean ridge is a rift valley 25-50 km wide and 1 km deep. Although oceanic spreading ridges appear to be curved features on Earth’s surface, in fact the ridges are composed of a series of straight-line segments, offset at intervals by faults perpendicular to the ridge, called transform faults. These transform faults make the mid-ocean ridge system look like a giant zipper on the seafloor (Figure 2.5.2). As we will see in section 3.7, movements along transform faults between two adjacent ridge segments are responsible for many earthquakes.
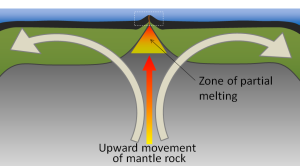
The crustal material created at a spreading boundary is always oceanic in character; in other words, it is igneous rock (e.g., basalt or gabbro, rich in ferromagnesian minerals), forming from magma derived from partial melting of the mantle caused by decompression as hot mantle rock from depth is moved toward the surface (Figure 2.5.3). The triangular zone of partial melting near the ridge crest is approximately 60 km thick and the proportion of magma is about 10% of the rock volume, thus producing crust that is about 6 km thick. This magma oozes out onto the seafloor to form pillow basalts, breccias (fragmented basaltic rock), and flows, interbedded in some cases with limestone or chert. Over time, the igneous rock of the oceanic crust gets covered with layers of sediment, which eventually become sedimentary rock.
Spreading is hypothesized to start within a continental area with up-warping or doming of crust related to an underlying mantle plume or series of mantle plumes. The buoyancy of the mantle plume material creates a dome within the crust, causing it to fracture. When a series of mantle plumes exists beneath a large continent, the resulting rifts may align and lead to the formation of a rift valley (such as the present-day Great Rift Valley in eastern Africa). It is suggested that this type of valley eventually develops into a linear sea (such as the present-day Red Sea), and finally into an ocean (such as the Atlantic). It is likely that as many as 20 mantle plumes, many of which still exist, were responsible for the initiation of the rifting of Pangaea along what is now the mid-Atlantic ridge.
There are multiple lines of evidence demonstrating that new oceanic crust is forming at these seafloor spreading centers:
1. Age of the crust:
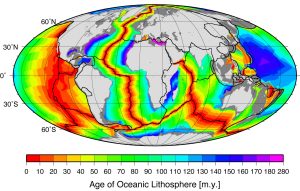
Comparing the ages of the oceanic crust near a mid-ocean ridge shows that the crust is youngest right at the spreading center, and gets progressively older as you move away from the divergent boundary in either direction, aging approximately 1 million years for every 20-40 km from the ridge. Furthermore, the pattern of crust age is fairly symmetrical on either side of the ridge (Figure 2.5.4).
The oldest oceanic crust is around 280 Ma in the eastern Mediterranean, and the oldest parts of the open ocean are around 180 Ma on either side of the north Atlantic. It may be surprising, considering that parts of the continental crust are close to 4,000 Ma old, that the oldest seafloor is less than 300 Ma. Of course, the reason for this is that all seafloor older than that has been either subducted (see section 3.6) or pushed up to become part of the continental crust. As one would expect, the oceanic crust is very young near the spreading ridges (Figure 2.5.4), and there are obvious differences in the rate of sea-floor spreading along different ridges. The ridges in the Pacific and southeastern Indian Oceans have wide age bands, indicating rapid spreading (approaching 10 cm/year on each side in some areas), while those in the Atlantic and western Indian Oceans are spreading much more slowly (less than 2 cm/year on each side in some areas).
2. Sediment thickness:
With the development of seismic reflection sounding (similar to echo sounding described in section 1.4) it became possible to see through the seafloor sediments and map the bedrock topography and crustal thickness. Hence sediment thicknesses could be mapped, and it was soon discovered that although the sediments were up to several thousands of meters thick near the continents, they were relatively thin — or even non-existent — in the ocean ridge areas (Figure 2.5.5). This makes sense when combined with the data on the age of the oceanic crust; the farther from the spreading center the older the crust, the longer it has had to accumulate sediment, and the thicker the sediment layer. Additionally, the bottom layers of sediment are older the farther you get from the ridge, indicating that they were deposited on the crust long ago when the crust was first formed at the ridge.
3. Heat flow:
Measurements of rates of heat flow through the ocean floor revealed that the rates are higher than average (about 8x higher) along the ridges, and lower than average in the trench areas (about 1/20th of the average). The areas of high heat flow are correlated with upward convection of hot mantle material as new crust is formed, and the areas of low heat flow are correlated with downward convection at subduction zones.
4. Magnetic reversals:
In section 2.2 we saw that rocks could retain magnetic information that they acquired when they were formed. However, Earth’s magnetic field is not stable over geological time. For reasons that are not completely understood, the magnetic field decays periodically and then becomes re-established. When it does re-establish, it may be oriented the way it was before the decay, or it may be oriented with the reversed polarity. During periods of reversed polarity, a compass would point south instead of north. Over the past 250 Ma, there have a few hundred magnetic field reversals, and their timing has been anything but regular. The shortest ones that geologists have been able to define lasted only a few thousand years, and the longest one was more than 30 million years, during the Cretaceous (Figure 2.5.6). The present “normal” event has persisted for about 780,000 years.

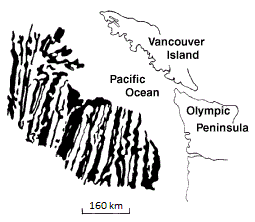
Beginning in the 1950s, scientists started using magnetometer readings when studying ocean floor topography. The first comprehensive magnetic data set was compiled in 1958 for an area off the coast of British Columbia and Washington State. This survey revealed a mysterious pattern of alternating stripes of low and high magnetic intensity in sea-floor rocks (Figure 2.5.7). Subsequent studies elsewhere in the ocean also observed these magnetic anomalies, and most importantly, the fact that the magnetic patterns are symmetrical with respect to ocean ridges.
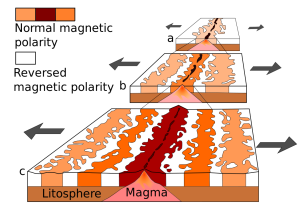
In the 1960s, in what would become known as the Vine-Matthews-Morley (VMM) hypothesis, it was proposed that the patterns associated with ridges were related to the magnetic reversals, and that oceanic crust created from cooling basalt during a normal event would have polarity aligned with the present magnetic field, and thus would produce a positive anomaly (a black stripe on the sea-floor magnetic map), whereas oceanic crust created during a reversed event would have polarity opposite to the present field and thus would produce a negative magnetic anomaly (a white stripe). The widths of the anomalies varied according to the spreading rates characteristic of the different ridges. This process is illustrated in Figure 2.5.8. New crust is formed (panel a) and takes on the existing normal magnetic polarity. Over time, as the plates continue to diverge, the magnetic polarity reverses, and new crust formed at the ridge now takes on the reversed polarity (white stripes in Figure 2.5.8). In panel b, the poles have reverted to normal, so once again the new crust shows normal polarity before moving away from the ridge. Eventually, this creates a series of parallel, alternating bands of reversals, symmetrical around the spreading center (panel c).
Marine Reptiles
Marine reptiles are cold blooded (ectothermic), meaning that their internal temperature is regulated by their surroundings and is not constant. They have scales that cover their bodies, they reproduce out of the water, and they evolved from amphibians. Today's marine reptiles include turtles, sea snakes, iguanas, and marine crocodiles.
Sea Turtles:
- 5 widely distributed tropical and subtropical species:
- Green, Hawksbill, Ridley, Leatherback and Loggerback
- All have large limbs and non-retractable heads
- All are excellent swimmers: the front limbs are flattened to act as oars, while the hind limbs work as rudders
- All grow to considerable size: the Atlantic Leatherback is the largest, growing to more than 1500 lbs and 11.5 ft long
- All are under threat of extinction
- The Green turtle is known for its long migrations, often of more than a thousand miles, between its feeding grounds and breeding areas
- Some use smell and vision, wave patterns, the angle of the sun and even celestial navigation to find a beach site close to where they were hatched
- if they survived there, then their offspring is more likely to survive
- https://www.seeturtles.org/sea-turtle-facts
Sea snakes:
- There are more than 50 species, which represent the most recently evolved group of marine reptiles
- They're found primarily in the warm oceans of the Indo-Pacific, but some can be found in the Atlantic (as seen in my photo)
- They grow to lengths of 4 to 10 feet
- Their bodies are flattened for swimming
- They breathe air, but have valves on their noses and can dive for crustaceans or shellfish
- They're truly marine except for one species that lays eggs on land – most give live birth at sea
- They also feed on small fish
- by catching and holding them in their jaws with their small teeth until their venom seeps into the wounds and kills the prey
- Their venom is among the most active of all known biological poisons
- the physiological effects are similar to those of cobra venom, only several times more toxic
- Fortunately for humans, they lack fangs to inject the venom and they are not terribly aggressive
- However, several people a year die from the bites of sea snakes, mostly fishermen who accidentally get bitten while removing them from their nets

Marine Iguanas:
- Found in the Galapagos Islands
- They're large, heavy and sluggish on land, but much more graceful in the sea
- They eat encrusting algae that they scrape from rocks with their spade-like teeth
Marine Crocodiles:
- These are occasional seafarers
- And are found mostly in the Indo-Pacific area from India to Australia
- They may grow to 30 ft in length
- They may be endangered because of predation by humans
Dr. Cristina Cardona
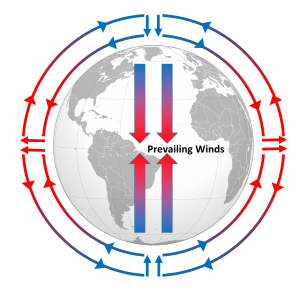
Differential heating of the Earth's surface results in equatorial regions receiving more heat than the poles (section 6.1). As air is warmed at the equator it becomes less dense and rises, while at the poles the cold air is denser and sinks. If the Earth was non-rotating, the warm air rising at the equator would reach the upper atmosphere and begin moving horizontally towards the poles. As the air reached the poles it would cool and sink, and would move over the surface of Earth back towards the equator. This would result in one large atmospheric convection cell in each hemisphere (Figure 6.2.1), with air rising at the equator and sinking at the poles, and the movement of air over the Earth's surface creating the winds. On this non-rotating Earth, the prevailing winds would thus blow from the poles towards the equator in both hemispheres (Figure 6.2.1).
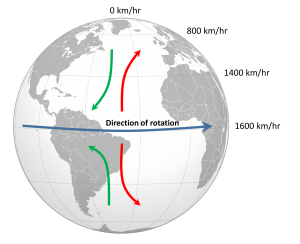
The non-rotating situation in Figure 6.2.1 is of course only hypothetical, and in reality the Earth's rotation makes this atmospheric circulation a bit more complex. The paths of the winds on a rotating Earth are deflected by the Coriolis Effect. The Coriolis Effect is a result of the fact that different latitudes on Earth rotate at different speeds. This is because every point on Earth must make a complete rotation in 24 hours, but some points must travel farther, and therefore faster, to complete the rotation in the same amount of time. In 24 hours a point on the equator must complete a rotation distance equal to the circumference of the Earth, which is about 40,000 km. A point right on the poles covers no distance in that time; it just turns in a circle. So the speed of rotation at the equator is about 1600 km/hr, while at the poles the speed is 0 km/hr. Latitudes in between rotate at intermediate speeds; approximately 1400 km/hr at 30o and 800 km/hr at 60o. As objects move over the surface of the Earth they encounter regions of varying speed, which causes their path to be deflected by the Coriolis Effect.
To explain the Coriolis Effect, imagine a cannon positioned at the equator and facing north. Even though the cannon appears stationary to someone on Earth, it is in fact moving east at about 1600 km/hr due to Earth's rotation. When the cannon fires the projectile travels north towards its target; but it also continues to move to the east at 1600 km/hr, the speed it had while it was still in the cannon. As the shell moves over higher latitudes, its momentum carries it eastward faster than the speed at which the ground beneath it is rotating. For example, by 30o latitude the shell is moving east at 1600 km/hr while the ground is moving east at only 1400 km/hr. Therefore, the shell gets "ahead" of its target, and will land to the east of its intended destination. From the point of view of the cannon, the path of the projectile appears to have been deflected to the right (red arrow, Figure 6.2.2). Similarly, a cannon located at 60o and facing the equator will be moving east at 800 km/hr. When its shell is fired towards the equator, the shell will be moving east at 800 km/hr, but as it approaches the equator it will be moving over land that is traveling east faster than the projectile. So the projectile gets "behind" its target, and will land to the west of its destination. But from the point of view of the cannon facing the equator, the path of the shell still appears to have been deflected to the right (green arrow, Figure 6.2.2). Therefore, in the Northern Hemisphere, the apparent Coriolis deflection will always be to the right.
In the Southern Hemisphere the situation is reversed (Figure 6.2.2). Objects moving towards the equator from the south pole are moving from low speed to high speed, so are left behind and their path is deflected to the left. Movement from the equator towards the south pole also leads to deflection to the left. In the Southern Hemisphere, the Coriolis deflection is always to the left from the point of origin.
The magnitude of the Coriolis deflection is related to the difference in rotation speed between the start and end points. Between the poles and 60o latitude, the difference in rotation speed is 800 km/hr. Between the equator and 30o latitude, the difference is only 200 km/hr (Figure 6.2.2). Therefore the strength of the Coriolis Effect is stronger near the poles, and weaker at the equator.
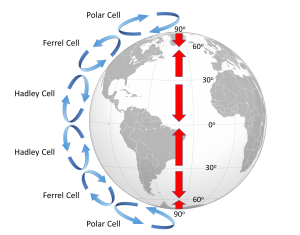
Because of the rotation of the Earth and the Coriolis Effect, rather than a single atmospheric convection cell in each hemisphere, there are three major cells per hemisphere. Warm air rising at the equator cools as it moves through the upper atmosphere, and it descends at around 30o latitude. The convection cells created by rising air at the equator and sinking air at 30o are referred to as Hadley Cells, of which there is one in each hemisphere. The cold air that descends at the poles moves over the Earth's surface towards the equator, and by about 60o latitude it begins to rise, creating a Polar Cell between 60o and 90o. Between 30o and 60o lie the Ferrel Cells, composed of sinking air at 30o and rising air at 60o (Figure 6.2.3). With three convection cells in each hemisphere that rotate in alternate directions, the surface winds no longer always blow from the poles towards the equator as in the non-rotating Earth in Figure 6.2.1. Instead, surface winds in both hemispheres blow towards the equator between 90o and 60o latitude, and between 0o and 30o latitude. Between 30o and 60o latitude, the surface winds blow towards the poles (Figure 6.2.3).
The surface winds created by the atmospheric convection cells are also influenced by the Coriolis Effect as they change latitudes. The Coriolis Effect deflects the path of the winds to the right in the Northern Hemisphere and to the left in the Southern Hemisphere. Adding this deflection leads to the pattern of prevailing winds illustrated in Figure 6.2.4. Between the equator and 30o latitude are the trade winds; the northeast trade winds in the Northern Hemisphere and the southeast trade winds in the Southern Hemisphere (note that winds are named based on the direction from which they originate, not where they are going). The westerlies are the dominant winds between 30o and 60o in both hemispheres, and the polar easterlies are found between 60o and the poles.
In between these wind bands lie regions of high and low pressure. High pressure zones occur where air is descending, while low pressure zones indicate rising air. Along the equator the rising air creates a low pressure region called the doldrums, or the Intertropical Convergence Zone (ITCZ)(convergence zone because this is where the trade winds converge). At 30o latitude there are high pressure zones of descending air known as the horse latitudes, or the subtropical highs. Finally, at 60o lies another low pressure region called the polar front. It should be noted that these high and low pressure zones are not fixed in place; their latitude fluctuates depending on the season, and these fluctuations have important implications for regional climates.
Doldrums? Horse latitudes? Trade winds?
These may seem like some odd names for these atmospheric phenomena, but many of them can be traced back to maritime traditions and lore.
The doldrums refer to regions of low pressure around the equator. In these areas, air is rising rather than moving horizontally, so these regions commonly encounter very light winds. The lack of wind could leave sailing ships becalmed for days or weeks at a time, which was not good for the morale of the ship's crew.
Like the doldrums the horse latitudes are also areas with light winds, this time due to descending air, which could leave ships becalmed. One explanation for the term "horse latitudes" is that when these ships became stranded they ran the risk of running out of food or water. To conserve these resources, sailors would throw their dead or dying horses overboard, hence the "horse latitudes." Another explanation is that many sailors received part of their pay before a voyage, and often spent it before departing. This meant that they would spend the first part of the voyage working without pay and in debt, a period called the "dead horse" time, which might last for a few months. When they started earning their pay once again, they had a "dead horse" ceremony and threw a pretend horse overboard. The timing of this ceremony often coincided with reaching the horse latitudes, leading to the association of the ceremony with the location. A third explanation is that a ship was referred to as "horsed" when winds were weak and the ship instead had to rely on ocean currents to move them. This could be a common occurrence in the high pressure zones around 30o latitude, so they were referred to as the horse latitudes.
The term trade winds may have originally derived from the terms for "track" or "path", but the term may have become more common during European exploration and commercialization of the New World. Mariners sailing from Europe to the New World could sail south until they reached the trade winds, which would then propel their ships across the Atlantic to the Caribbean. To return to Europe, ships could sail to the northeast until they entered the westerlies, which would then steer them back to Europe.
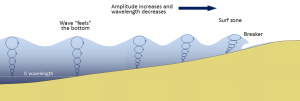
Most of the waves discussed in the previous section referred to deep water waves in the open ocean. But what happens when these waves move towards shore and encounter shallow water? Remember that in deep water, a wave’s speed depends on its wavelength, but in shallow water wave speed depends on the depth (section 3.1). When waves approach the shore they will "touch bottom" at a depth equal to half of their wavelength; in other words, when the water depth equals the depth of the wave base (Figure 3.3.1). At this point their behavior will begin to be influenced by the bottom.
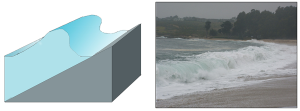
When the wave touches the bottom, friction causes the wave to slow down. As one wave slows down, the one behind it catches up to it, thus decreasing the wavelength. However, the wave still contains the same amount of energy, so while the wavelength decreases, the wave height increases. Eventually the wave height exceeds 1/7 of the wavelength, and the wave becomes unstable and forms a breaker. Often breakers will start to curl forwards as they break. This is because the bottom of the wave begins to slow down before the top of the wave, as it is the first part to encounter the seafloor. So the crest of the wave gets “ahead” of the rest of the wave, but has no water underneath it to support it (Figure 3.3.1).
There are three main types of breakers: spilling, plunging, and surging. These are related to the steepness of the bottom, and how quickly the wave will slow down and its energy will get dissipated.
- Spilling breakers form on gently sloping or flatter beaches, where the energy of the wave is dissipated gradually. The wave slowly increases in height, then slowly collapses on itself (Figure 3.3.2). For surfers, these waves provide a longer ride, but they are less exciting.

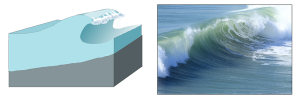
- Plunging breakers form on more steeply-sloped shores, where there is a sudden slowing of the wave and the wave gets higher very quickly. The crest outruns the rest of the wave, curls forwards and breaks with a sudden loss of energy (Figure 3.3.3). These are the “pipeline” waves that surfers seek out.

- Surging breakers form on the steepest shorelines. The wave energy is compressed very suddenly right at the shoreline, and the wave breaks right onto the beach (Figure 3.3.4). These waves give too short (and potentially painful) a ride for surfers to enjoy.

Wave Refraction
Swell can be generated anywhere in the ocean and therefore can arrive at a beach from almost any direction. But if you have ever stood at the shore you have probably noticed that the waves usually approach the shore somewhat parallel to the coast. This is due to wave refraction. If a wave front approaches shore at an angle, the end of the wave front closest to shore will touch bottom before the rest of the wave. This will cause that shallower part of the wave to slow down first, while the rest of the wave that is still in deeper water will continue on at its regular speed. As more and more of the wave front encounters shallower water and slows down, the wave font refracts and the waves tend to align themselves nearly parallel to the shoreline (they are refracted towards the region of slower speed). As we will see in section 5.2, the fact that the waves do not arrive perfectly parallel to the beach causes longshore currents and longshore transport that run parallel to the shore.
Refraction can also explain why waves tend to be larger off of points and headlands, and smaller in bays. A wave front approaching shore will touch the bottom off of the point before it touches bottom in a bay. Once again, the shallower part of the wave front will slow down, and cause the rest of the wave front to refract towards the slower region (the point). Now all of the initial wave energy is concentrated in a relatively small area off of the point, creating large, high energy waves (Figure 3.3.6). In the bay, the refraction has caused the wave fronts to refract away from each other, dispersing the wave energy, and leading to calmer water and smaller waves. This makes the large waves of a “point break” ideal for surfing, while water is calmer in a bay, which is where people would launch a boat. This difference in wave energy also explains why there is net erosion on points, while sand and sediments get deposited in bays (see section 5.3).

By Paul Webb, used under a CC-BY 4.0 international license. Download this book for free at https://rwu.pressbooks.pub/webboceanography/front-matter/preface/
Protecting the Marine Environment
Many national, state, and local governments and organizations have been struggling for decades to manage marine pollution and protect coastal environments. In the United States, the National Oceanographic and Atmospheric Administration (NOAA) overseas large portions of the coastal waters around North America, attempting to stop overfishing and restricting coastal development in many regions. Expanding efforts involve protecting coastal wetlands, mitigating coastal hazards, ensuring public coastal access, protecting beaches and coastal park lands, locating of energy and government facilities, and managing sensitive habitats, fishery areas, and aquaculture. Efforts are underway nationwide to prevent and control polluted runoff by replacing outdated storm water runoff and sewage systems, reducing agricultural pollutants, preventing or mitigating development within sensitive habitats and erosion-prone areas, and finding ways for communities to reduce refuse and debris from entering coastal waters.
Focus on Coral Reefs
Coral reefs (or coral ecosystems) are among the most important and also most sensitive habitats throughout the world’s oceans. Reefs provide habitat, spawning and nursery grounds for economically important fish species, and are hotspots of marine biodiversity. For humanity, coral reefs provide billions of dollars in economic and environmental benefits, including fishing, coastal protection, recreation, and tourism. Hundreds of millions of people worldwide depend of reef ecosystems for their livelihoods and food. However, coral ecosystems face serious threats from unsustainable fishing and land-based pollution (Figures 17-30 and 17-31).
Unfortunately, many of the world’s reefs have already been destroyed or severely damaged by pollution, unsustainable fishing practices, disease, introduction of invasive species, ship groundings, uncontrolled coastal development and other impacts.
Human activities are a primary cause for reef destruction. Pollutants from expanding coastal communities find their way to shallow coastal waters dominated by coral reefs, mostly in warm tropical waters. Many of the sea creatures, particularly invertebrates that attach to the seabed and filter seawater. Tourist visiting reefs step on fragile reef structures, introduce chemicals (such as zinc and other compounds in sun screen). Sewage and urban runoff carries silt (increasing turbidity) and introduce toxins that impact or kill reef organisms. Perhaps most alarming are the impacts of changes in water temperature and water chemistry associated with climate change.
Climate Change - The most important environmental issue of our times!
Studies conducted throughout the world’s oceans show the coral ecosystems are showing the detrimental effects of climate change caused by the burning of fossil fuels, deforestation, and bad agricultural practices that release large quantities of greenhouse gases into the atmosphere.
Climate change impacts coral ecosystems by increasing sea-surface temperatures and increased carbon dioxide levels in seawater. Long-term studies of CO2 concentrations in seawater show trends in reducing calcification rates in reef-building and reef-associated organisms. Increased sea surface temperature leads to coral bleaching (a result in the loss of symbiotic algae and bacteria) and death of skeletal reef-building organism. Weakened coral communities are susceptible to infection disease. Pollution from coastal development and agricultural runoff can also impede coral growth and reproduction, disrupt ecological functions, and cause disease.
Coal is the most carbon-intensive fossil fuel, producing the most carbon dioxide per unit volume burned. For every ton of coal burned, approximately 2.5 tons of CO2 is released into the air. Globally, coal is the largest-used fossil fuel source and the highest production of carbon dioxide emissions. Although coal represents only about one-third of share of fossil fuels consumed by the world’s total primary energy supply, coal is responsible for 43% of carbon dioxide emissions from burning fossil fuels.
Politics of Climate Change: Sadly, our world may be in big trouble because of the economics associated with energy and agricultural demands of a growing world population. Failure to address carbon emissions and the resultant impacts of rising temperatures and ocean acidification could make many marine and coastal management efforts futile. While reducing CO2 and other greenhouse gas emissions is vital to stabilize the global climate is essential, the excess that already exists in the atmosphere will persist throughout the next century.
Climate changes will have many impacts on marine systems including reduction in marine biodiversity, sea level is rising, and long-term forecasts predict changes in the frequency, intensity, and distribution of tropical storms as atmospheric and ocean circulation patterns change.
Politics vs. Technology: The key to saving or destroying our natural environments
The climate change issues will be every-increasingly important as the impacts become increasingly obvious as the number of natural and man-made disasters steadily rises. Humans have to collectively choose, through political means, to make the choices to change to cleaner technologies, and protecting and managing resources. The choices to move away from fossil-fuel consumption to alternative energy sources will be expensive and a hard fight because it will impact the livelihoods of many people (such as coal miners and workers in the petroleum industries). Predicted sea-level rise and global warming will impact all world's communities, both human and ecosystems. There will be many winners and losers in the transition to a cleaner, more sustainable world. Accepting the consequences for climate change will create many new jobs in the process. The longer humanity waits to make these changes, the greater the environmental problems will be in the future. "We can't fool mother nature!"
From Miracosta College, is shared under a not declared license and was authored, remixed, and/or curated by LibreTexts. Download this book for free at https://geo.libretexts.org/Bookshelves/Oceanography/Oceanography_101_(Miracosta)
Most of the waves discussed in the previous section referred to deep water waves in the open ocean. But what happens when these waves move towards shore and encounter shallow water? Remember that in deep water, a wave’s speed depends on its wavelength, but in shallow water wave speed depends on the depth (section 3.1). When waves approach the shore they will "touch bottom" at a depth equal to half of their wavelength; in other words, when the water depth equals the depth of the wave base (Figure 3.3.1). At this point their behavior will begin to be influenced by the bottom.
When the wave touches the bottom, friction causes the wave to slow down. As one wave slows down, the one behind it catches up to it, thus decreasing the wavelength. However, the wave still contains the same amount of energy, so while the wavelength decreases, the wave height increases. Eventually the wave height exceeds 1/7 of the wavelength, and the wave becomes unstable and forms a breaker. Often breakers will start to curl forwards as they break. This is because the bottom of the wave begins to slow down before the top of the wave, as it is the first part to encounter the seafloor. So the crest of the wave gets “ahead” of the rest of the wave, but has no water underneath it to support it (Figure 3.3.1).

There are three main types of breakers: spilling, plunging, and surging. These are related to the steepness of the bottom, and how quickly the wave will slow down and its energy will get dissipated.
- Spilling breakers form on gently sloping or flatter beaches, where the energy of the wave is dissipated gradually. The wave slowly increases in height, then slowly collapses on itself (Figure 3.3.2). For surfers, these waves provide a longer ride, but they are less exciting.

- Plunging breakers form on more steeply-sloped shores, where there is a sudden slowing of the wave and the wave gets higher very quickly. The crest outruns the rest of the wave, curls forwards and breaks with a sudden loss of energy (Figure 3.3.3). These are the “pipeline” waves that surfers seek out.
- Surging breakers form on the steepest shorelines. The wave energy is compressed very suddenly right at the shoreline, and the wave breaks right onto the beach (Figure 3.3.4). These waves give too short (and potentially painful) a ride for surfers to enjoy.
Wave Refraction
Swell can be generated anywhere in the ocean and therefore can arrive at a beach from almost any direction. But if you have ever stood at the shore you have probably noticed that the waves usually approach the shore somewhat parallel to the coast. This is due to wave refraction. If a wave front approaches shore at an angle, the end of the wave front closest to shore will touch bottom before the rest of the wave. This will cause that shallower part of the wave to slow down first, while the rest of the wave that is still in deeper water will continue on at its regular speed. As more and more of the wave front encounters shallower water and slows down, the wave font refracts and the waves tend to align themselves nearly parallel to the shoreline (they are refracted towards the region of slower speed). As we will see in section 5.2, the fact that the waves do not arrive perfectly parallel to the beach causes longshore currents and longshore transport that run parallel to the shore.
Refraction can also explain why waves tend to be larger off of points and headlands, and smaller in bays. A wave front approaching shore will touch the bottom off of the point before it touches bottom in a bay. Once again, the shallower part of the wave front will slow down, and cause the rest of the wave front to refract towards the slower region (the point). Now all of the initial wave energy is concentrated in a relatively small area off of the point, creating large, high energy waves (Figure 3.3.6). In the bay, the refraction has caused the wave fronts to refract away from each other, dispersing the wave energy, and leading to calmer water and smaller waves. This makes the large waves of a “point break” ideal for surfing, while water is calmer in a bay, which is where people would launch a boat. This difference in wave energy also explains why there is net erosion on points, while sand and sediments get deposited in bays (see section 5.3).
By Paul Webb, used under a CC-BY 4.0 international license. Download this book for free at https://rwu.pressbooks.pub/webboceanography/front-matter/preface/
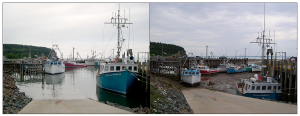
The Equilibrium Theory of tides predicts that each day there will be two high and two low tides, each one occurring at the same time day after day, with each pair producing tides of similar heights. While this view provides a basic explanation for the primary forces that generate the tides, it does not take into account such variables as the effects of the continents, the depth of the water, and many other factors. In all, there are almost 400 variables that must be incorporated into predicting the tides! The Dynamic Theory of tides takes these other factors into account, and shows that the tides are much more complicated and variable from place to place than the Equilibrium Theory would suggest. For example, some areas receive only one high and one low tide per day (see section 3.7). Furthermore, the tidal range varies greatly across the globe; in the Mediterranean Sea, there can be a difference of only 10 cm between high and low tides, while the Bay of Fundy in Canada experiences a tidal range of up to 17m (56 ft) every day (Figure 3.6.1).
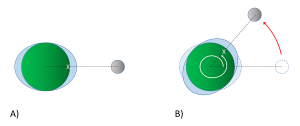
Examination of any tide chart will show that the tides don’t occur at same time each day; in fact, each tidal peak occurs about 50 minutes later than it did in the previous day. This is due to the orbit of the moon around the Earth. Imagine a high tide that occurs at a particular location (X) at 1:00 pm (Figure 3.6.2). The high tide occurs as location X moves through the bulge of water facing the moon. It will take the Earth 24 hours to complete one revolution, to bring location X back to site of the water bulge that caused that high tide. However, during those 24 hours, the moon has also moved as it orbits the Earth, so the high tide bulge has moved beyond its original location. The Earth thus has to rotate an additional distance for location X to reach the bulge and experience that same high tide. Because it takes the moon about 28 days to orbit the Earth, the moon gets "ahead" of the Earth's rotation by about 50 minutes per day. Therefore, it takes location X 24 hours and 50 minutes to rotate through the same tidal bulge, and as a result, the tidal peaks occur about 50 minutes later each day. In our example, an afternoon high tide at 1:00 pm on one day would be followed by a high tide at about 1:50 pm the following day. This 24 hour and 50 minute cycle is referred to as a tidal day.
The motion of the moon impacts the tidal cycles in other ways. As the moon orbits the Earth, its orbital plane is at an angle relative to the rotational plane of Earth. This angle, or declination, means than the moon fluctuates between an angle of 28.5o north of the equator, to 28.5o south of the equator roughly every two weeks (the cycle from maximum to minimum and back takes about 27 days). Figure 3.6.3 illustrates a case where the moon is at its maximum declination 28.5o north of the equator, creating its corresponding tidal maxima. A point on the Earth at the latitude indicated by the red line would experience two high tides as it rotated through 24 hours, at points A and B. But the two high tides would not be of equal heights; the high tide at A would be higher than the high tide at B. This helps create a mixed semi-diurnal tide; two high tides of different heights per day (see section 3.7).

Finally, the continents and the bottom topography of the oceans have an impact on the tides that are experienced in an area. Because the tides are essentially waves with extremely long wavelengths extending halfway across the Earth, they behave as shallow water waves, and they are influenced and refracted by the bottom contours, leading to regional tidal variations. When the tidal crests encounter land, they are are reflected, and the wave moves back out to sea, theoretically until it encounters another continent on the opposite side of the ocean basin. The crest is once again reflected, and the water oscillates back and forth as a standing wave across the ocean basin. However, because of the scale over which these tidal waves move, we must take into account the influence of the Coriolis Effect. As the tidal crest is reflected back across the ocean basin, its path is deflected by the Coriolis force; to the right in the Northern Hemisphere, and to the left in the Southern Hemisphere. Using the Northern Hemisphere as an example, imagine a tidal crest that has reached land on the western side of an ocean basin. It would have a tendency to be reflected and move across the basin towards the east. But the Coriolis force deflects the movement to the right, causing the crest to instead head south. When the crest hits land in the south, it would now tend to reflect towards the north, but once again the Coriolis deflection to the right kicks in, and the wave instead moves to the east. From the east the reflected wave is deflected to the north, and so on. The result of all of this is that instead of a simple standing wave moving back and forth across the ocean, the tidal crest follows a circular pattern around the ocean basin, counterclockwise in the Northern Hemisphere and clockwise in the Southern Hemisphere. This is analogous to shaking a pan full of water in a circular manner, and watching the water follow a similar circular path as it sloshes around inside. This large scale circular rotation pattern of tides is called amphidromic circulation (Figure 3.6.4). The rotation occurs around a central amphidromic point or node, that shows little tidal variation, while the largest tidal ranges occur on the edges of the circulation pattern. In Figure 3.6.4 the amphidromic points are indicated by the dark blue areas where the white lines converge, like spokes from a bicycle wheel, and the dark red and brown areas show the regions of maximum tidal heights. The tidal maxima will rotate around the amphidromic points, taking about 12 hours for a complete rotation, leading to two high and two low tides per day in many places. If a tidal maximum is occurring along one of the white lines in Figure 3.6.4 at a certain time in the Northern Hemisphere, one hour later that high tide will have moved to the white line to the left (counterclockwise), and so on until it completes a rotation. In the Southern Hemisphere, the tide will move to the line to the right for clockwise rotation.

The result of all of these variables is that the tides will not always occur twice each day, at the same time and with equal heights as the Equilibrium Theory of tides may suggest. Instead, each region of the oceans has a unique set of factors that contribute to the types of tides it will experience. The major types of tides are discussed in the next section.
By Paul Webb, used under a CC-BY 4.0 international license. Download this book for free at https://rwu.pressbooks.pub/webboceanography/front-matter/preface/
In addition to fish, the ocean is also home to a variety of birds. These birds are referred to as seabirds because they spend a considerable amount of time around the sea. Many seabirds spend their entire lives in the ocean, only coming to land to reproduce. Some seabirds dive and swim below the surface, such as penguins, whose wings are modified into flippers, or cormorants, whose webbed feet act as paddles. Others stay at the surface, only hunting in the uppermost meter of the water (Keddy). Please go to this website to read more about seabirds: https://ca.audubon.org/what-s-seabird
Birds evolved from reptilian ancestors
Birds split from the main reptile branch about 150 million years ago with an intermediate form known as Archaeopteryx, which was about the size of a crow. They have reptilian characteristics, such as their feet and lower legs are covered with scales and terminate in claws, their reproductive physiology is basically reptilian (laying eggs), their feathers are believed to have been derived from scales, and have many other developmental and structural similarities with reptiles. Yet, unlike reptiles, birds are warm-blooded (endothermic) and maintain a constant internal body temperature.
Marine birds
Marine birds tend to be larger and stronger than their land counterparts. They have a lightweight, low-density body structure with hollow bones. Their wings are long, pointed and cupped underneath to support a large and muscular organism aloft for long periods of time.
They do not drink freshwater. Instead, they have salt glands over their eyes that remove the salt, thus permitting them to drink seawater, freeing them from dependence on freshwater from the land. The salty fluid is expelled through their bills.
The albatross
- This is one of the largest of the oceanic birds, with a wingspan of up to 12 feet
- They are the best gliders in the world – may remain aloft for months at a time, taking advantage of the west wind drift (winds that blow completely around Antarctica)
Pelicans
- This prehistoric-looking bird feeds by diving on its prey and entrapping it in its large gular pouch
- It has air sacs in its shoulders that absorb the impact with the water
Arctic Terns
- This bird feeds on small fish swimming near the surface that it catches by diving. It may even swim below the surface after them
- It lives at high latitudes and breeds on all far north rocky coasts
- However, it dislikes cold weather, so makes the longest migration of any animal, 15,000 miles each way
Penguins
- Penguins are found only in the southern hemisphere
- They are flightless birds that "fly" through the water after fish, squid and krill
- They slow their heart rate
- Have subcutaneous fat layers for insulation
- Have heavy plumage for insulation
- Their bodies are streamlined
- They have heavy feet for paddling and kicking against the water
- Their blood is shunted to the heart and brain and the extremities are deprived of blood, in order to slow heat loss
- These apply to most diving birds
Emperor Penguin: These are the largest diving birds in the world, up to 4 ft in height
- They're the best bird divers in the world, can routinely dive for 5-10 minutes (most bird dives last 30 seconds to a minute) and at best can stay down for 15-18 minutes, diving to over 1000 feet
- They eat small fish and krill – penguin populations have increased as a result of the killing off of the great whales – more krill is available as food for penguins
Penguin Adaptations
- They fluff their feathers to create trapped air in a dead space
- They have long feathers
- They rock back and forth on their heels on the ice to limit the area in contact with the ice and slow heat loss
- They can reduce blood flow to and heat loss from their wings and feet
- They exhibit "huddle" behavior – gathering in large groups and constantly changing position so that each gets a turn in the center, where it's warmest
The first paragraph, by Keddy (University of California, Davis), is shared under a not declared license and was authored, remixed, and/or curated by LibreTexts. Download this book for free at https://geo.libretexts.org/Courses/Diablo_Valley_College/OCEAN-101%3A_Fundamentals_of_Oceanography_(Keddy)
The rest was written by Dr. Cristina Cardona.

