18 3.1 Wave Basics
Waves generally begin as a disturbance of some kind, and the energy of that disturbance gets propagated in the form of waves. We are most familiar with the kind of waves that break on shore, or rock a boat at sea, but there are many other types of waves that are important to oceanography:
- Internal waves form at the boundaries of water masses of different densities (i.e. at a pycnocline), and propagate at depth. These generally move more slowly than surface waves, and can be much larger, with heights exceeding 100 m. However, the height of the deep wave would be unnoticeable at the surface.
- Tidal waves are due to the movement of the tides. What we think of as tides are basically enormously long waves with a wavelength that may span half the globe (see section 4.1). Tidal waves are not related to tsunamis, so don’t confuse the two.
- Tsunamis are large waves created as a result of earthquakes or other seismic disturbances. They are also called seismic sea waves (section 3.4).
- Splash waves are formed when something falls into the ocean and creates a splash. The giant wave in Lituya Bay that was described in the introduction to this chapter was a splash wave.
- Atmospheric waves form in the sky at the boundary between air masses of different densities. These often create ripple effects in the clouds (Figure 3.1.1).
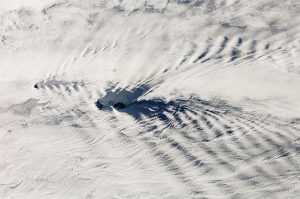
There are several components to a basic wave (Figure 3.1.2):
- Still water level: where the water surface would be if there were no waves present and the sea was completely calm.
- Crest: the highest point of the wave.
- Trough: the lowest point of the wave.
- Wave height: the distance between the crest and the trough.
- Wavelength: the distance between two identical points on successive waves, for example crest to crest, or trough to trough.
- Wave steepness: the ratio of wave height to length (H/L). If this ratio exceeds 1/7 (i.e. height exceeds 1/7 of the wavelength) the wave gets too steep, and will break.

There are also a number of terms used to describe wave motion:
- Period: the time it takes for two successive crests to pass a given point.
- Frequency: the number of waves passing a point in a given amount of time, usually expressed as waves per second. This is the inverse of the period.
- Speed: how fast the wave travels, or the distance traveled per unit of time. This is also called celerity (c), where
c = wavelength x frequency
Therefore, the longer the wavelength, the faster the wave.
Although waves can travel over great distances, the water itself shows little horizontal movement; it is the energy of the wave that is being transmitted, not the water. Instead, the water particles move in circular orbits, with the size of the orbit equal to the wave height (Figure 3.1.3). This orbital motion occurs because water waves contain components of both longitudinal (side to side) and transverse (up and down) waves, leading to circular motion. As a wave passes, water moves forwards and up over the wave crests, then down and backwards into the troughs, so there is little horizontal movement. This is evident if you have ever watched an object such as a seabird floating at the surface. The bird bobs up and down as the wave pass underneath it; it does not get carried horizontally by a single wave crest.
Figure 3.1.3 Animation showing the orbital motion of particles in a surface wave (By Kraaiennest (Own work) [GFDL (http://www.gnu.org/copyleft/fdl.html) or CC BY-SA 4.0], via Wikimedia Commons).
The circular orbital motion declines with depth as the wave has less impact on deeper water and the diameter of the circles is reduced. Eventually at some depth there is no more circular movement and the water is unaffected by surface wave action. This depth is the wave base and is equivalent to half of the wavelength (Figure 3.1.4). Since most ocean waves have wavelengths of less than a few hundred meters, most of the deeper ocean is unaffected by surface waves, so even in the strongest storms marine life or submarines can avoid heavy waves by submerging below the wave base.
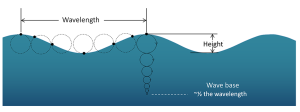
When the water below a wave is deeper than the wave base (deeper than half of the wavelength), those waves are called deep water waves. Most open ocean waves are deep water waves. Since the water is deeper than the wave base, deep water waves experience no interference from the bottom, so their speed only depends on the wavelength:
[latex]\text{speed (m/s)} = \sqrt{\frac{gL}{2\pi}}[/latex]
where g is gravity and L is wavelength in meters. Since g and π are constants, this can be simplified to:
[latex]\text{speed (m/s)} = 1.25\sqrt{L}[/latex]
Shallow water waves occur when the depth is less than 1/20 of the wavelength. In these cases, the wave is said to "touch bottom" because the depth is shallower than the wave base so the orbital motion is affected by the seafloor. Due to the shallow depth, the orbits are flattened, and eventually the water movement becomes horizontal rather than circular just above the bottom. The speed of shallow water waves depends only on the depth:
[latex]\text{speed (m/s)} = \sqrt{gd}[/latex]
where g is gravity and d is depth in meters. This can be simplified to:
[latex]\text{speed (m/s)} = 3.13\sqrt{d}[/latex]
Intermediate or transitional waves are found in depths between ½ and 1/20 of the wavelength. Their behavior is a bit more complex, as their speed is influenced by both wavelength and depth. The speed of an intermediate wave is calculated as:
which contains both depth and wavelength variables.
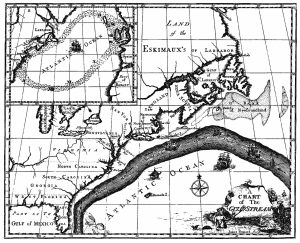
The primary surface current along the east coast of the United States is the Gulf Stream, which was first mapped by Benjamin Franklin in the 18th century (Figure 7.2.1). As a strong, fast current, it reduced the sailing time for ships traveling from the United States back to Europe, so sailors would use thermometers to locate its warm water and stay within the current.
The Gulf Stream is formed from the convergence of the North Atlantic Equatorial Current bringing tropical water from the east, and the Florida Current that brings warm water from the Gulf of Mexico. The Gulf Stream takes this warm water and transports it northwards along the U.S. east coast (Figure 7.2.2). As a western boundary current, the Gulf Stream experiences western intensification (section 7.4), making the current narrow (50-100 km wide), deep (to depths of 1.5 km) and fast. With an average speed of 6.4 km/hr, and a maximum speed of about 9 km/hr, it is the fastest current in the world ocean. It also transports huge amounts of water, more than 100 times greater than the combined flow of all of the rivers on Earth.
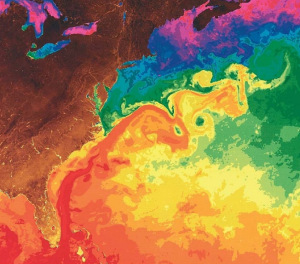
As the Gulf Stream approaches Canada, the current becomes wider and slower as the flow dissipates and it encounters the cold Labrador Current moving in from the north. At this point, the current begins to meander, or change from a fast, straight flow to a slower, looping current (Figure 7.2.2). Often these meanders loop so much that they pinch off and form large rotating water masses called rings or eddies, that separate from the Gulf Stream. If an eddy pinches off from the north side of the Gulf Stream, it entraps a mass of warm water and moves it north into the surrounding cold water of the North Atlantic. These warm core rings are shallow, bowl-shaped water masses about 1 km deep, and about 100 km across, that rotate clockwise as they carry warm water in to the North Atlantic (Figure 7.2.3). If the meanders pinch off at the southern boundary of the Gulf Stream, they form cold core rings that rotate counterclockwise and move to the south. Cold core rings are cone-shaped water masses extending down to over 3.5 km deep, and may be over 500 km wide at the surface.
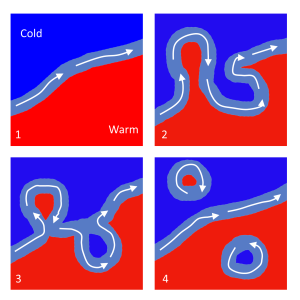
After the Gulf Stream meets the cold Labrador Current, it joins the North Atlantic Current, which transports the warm water towards Europe, where it moderates the European climate. It is estimated that Northern Europe is up to 9o C warmer than expected because of the Gulf Stream, and the warm water helps to keep many northern European ports ice-free in the winter.
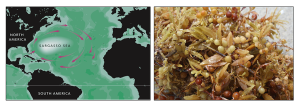
In the east, the Gulf Stream merges into the Sargasso Sea, which is the area of the ocean within the rotation center of the North Atlantic gyre. The Sargasso Sea gets its name from the large floating mats of the marine algae Sargassum that are abundant on the surface (Figure 7.2.4). These Sargassum mats may play an important role in the early life stages of sea turtles, who may live and feed within the algae for many years before reaching adulthood.
The most obvious feature of the oceans is that they contain water. Water is so ubiquitous that it may not seem like a very interesting substance, but it has many unique properties that impact global oceanographic and climatological processes. Many of these processes are due to hydrogen bonds forming between water molecules.
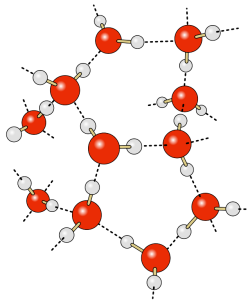
The water molecule consists of two hydrogen atoms and one oxygen atom. The electrons responsible for the bonds between the atoms are not distributed equally throughout the molecule, so that the hydrogen ends of water molecules have a slight positive charge, and the oxygen end has a slight negative charge, making water a polar molecule. The negative oxygen side of the molecule forms an attraction to the positive hydrogen end of a neighboring molecule. This rather weak force of attraction is called a hydrogen bond (Figure 5.1.1). If not for hydrogen bonds, water would vaporize at -68o C, meaning liquid water (and thus life) could not exist on Earth. These hydrogen bonds are responsible for some of water’s unique properties:
1. Water is the only substance to naturally exist in a solid, liquid, and gaseous form under the normal range of temperatures and pressures found on Earth. This is due to water’s relatively high freezing and vaporizing points (see below).
2. Water has a high heat capacity, which is the amount of heat that must be added to raise its temperature. Specific heat is the heat required to raise the temperature of 1 g of a substance by 1o C. Water has the highest specific heat of any liquid except ammonia (Table 5.1.1).
Table 5.1.1 Specific heat values for a number of common substances
| Specific Heat (calories/g/Co) | |
|---|---|
| Ammonia | 1.13 |
| Water | 1.00 |
| Acetone | 0.51 |
| Grain Alcohol | 0.23 |
| Aluminum | 0.22 |
| Copper | 0.09 |
| Silver | 0.06 |
Water is therefore one of the most difficult liquids to heat or cool; it can absorb large amounts of heat without increasing its temperature. Remember that temperature reflects the average kinetic energy of the molecules within a substance; the more vigorous the motion, the higher the temperature. In water, the molecules are held together by hydrogen bonds, and these bonds must be overcome to allow the molecules to move freely. When heat is added to water the energy must first go to breaking the hydrogen bonds before the temperature can begin to rise. Therefore, much of the added heat is absorbed by breaking H bonds, not by increasing the temperature, giving water a high heat capacity.
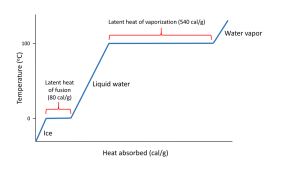
Hydrogen bonds also give water a high latent heat; the heat required to undergo a phase change from solid to liquid, or liquid to gas. The latent heat of fusion is the heat required to go from solid to liquid; 80 cal/g in the case of ice melting to water. Ice is a solid because hydrogen bonds hold the water molecules into a solid crystal lattice (see below). As ice is heated, the temperature rises up to 0o C. At that point, any additional heat goes to melting the ice by breaking the hydrogen bonds, not to increasing the temperature. So as long as ice is present, the water temperature will not increase. This is why your drink will remain cold as long as it contains ice; any heat absorbed goes to melting the ice, not to warming the drink.
When all of the ice is melted, additional heat will increase the temperature of the water 1o C for each calorie of heat added, until it reaches 100o C. At that point, any additional heat goes to overcoming the hydrogen bonds and turning the liquid water into water vapor, rather than increasing the water temperature. The heat required to evaporate liquid water into water vapor is the latent heat of vaporization which has a value of 540 cal/g (Figure 5.1.2).
The high heat capacity of water helps regulate global climate, as the oceans slowly absorb and release heat, preventing rapid swings in temperature (see section 8.1). It also means that aquatic organisms aren't as subjected to the same rapid temperature changes as terrestrial organisms. A deep ocean organism may not experience more than a 0.5o C change in temperature over its entire life, while a terrestrial species may encounter changes of more than 20o C in a single day!
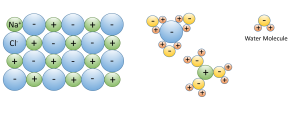
3. Water dissolves more substances than any other liquid; it is a "universal solvent", which is why so many substances are dissolved in the ocean. Water is especially good at dissolving ionic salts; molecules made from oppositely charged ions such as NaCl (Na+ and Cl-). In water, the charged ions attract the polar water molecules. The ions get surrounded by a layer of water molecules, weakening the bond between the ions by up to 80 times. With the bonds weakened between ions, the substance dissolves (Figure 5.1.3).
4. The solid phase is less dense than the liquid phase. In other words, ice floats. Most substances are denser in the solid form than in the liquid form, as their molecules are more closely packed together as a solid. Water is an exception: the density of fresh water is 1.0 g/cm3, while the density of ice is 0.92 g/cm3, and once again, this is due to the action of hydrogen bonds.
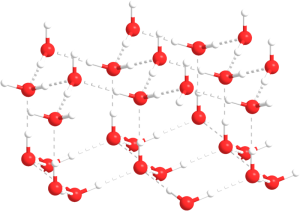
As water temperature cools the molecules slow down, eventually slowing enough that hydrogen bonds can form and hold the water molecules in a crystal lattice. The molecules in the lattice are spaced farther apart than the molecules in liquid water, which makes ice less dense than liquid water (Figure 5.1.4). This is familiar to anyone who has ever left a full water bottle in the freezer, only to have it burst as the water freezes and expands.
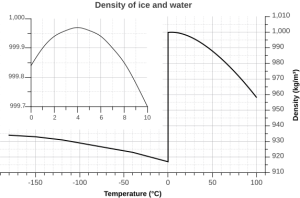
But the relationship between temperature and water density is not a simple linear one. As water cools, its density increases as expected, as the water molecules slow down and get closer together. However, fresh water reaches its maximum density at a temperature of 4o C, and as it cools beyond that point its density declines as the hydrogen bonds begin to form and the intermolecular spacing increases (Figure 5.1.5 inset). The density continues to decline until the temperature reaches 0o C and ice crystals form, reducing the density dramatically (Figure 5.1.5).
There are a number of important implications to ice being less dense than water. Ice floating on the surface of the ocean helps regulate ocean temperatures, and therefore global climate, by influencing the amount of sunlight that is reflected rather than absorbed (see section 5.6). On a smaller scale, surface ice can prevent lakes and ponds from freezing solid during the winter. As fresh surface water cools, the water gets denser, and sinks to the bottom. The new surface water then cools and sinks, and the process is repeated in what is referred to as overturning, with denser water sinking and less dense water moving to the surface only to be cooled and sink itself. In this way, the entire body of water is cooled somewhat evenly. This process continues until the surface water cools below 4o C. Below 4o C, the water becomes less dense as it cools, so it no longer sinks. Instead, it remains as the surface, getting colder and less dense, until it freezes at 0o C. Once fresh water freezes, the ice floats and insulates the rest of the water beneath it, reducing further cooling. The densest bottom water is still at 4o C, so it does not freeze, allowing the bottom of a lake or pond to remain unfrozen (which is good news for the animals living there) no matter how cold it gets outside.
The dissolved salts in seawater inhibit the formation of the crystal lattice, and therefore make it harder for ice to form. So seawater has a freezing point of about -2o C (depending on salinity), and freezes before a temperature of maximum density is reached. Thus seawater will continue to sink as it gets colder, until it finally freezes.
5. Water has a very high surface tension, the highest of any liquid except mercury (Table 5.1.2). Water molecules are attracted to each other by hydrogen bonds. For molecules not at the water surface, they are surrounded by other water molecules in all directions, so the attractive forces are evenly distributed in all directions. But for molecules at the surface there are few adjacent molecules above them, only below, so all of the attractive forces are directed inwards, away from the surface (Figure 5.1.6). This inwards force is what causes water droplets to take on a spherical shape, and water to bead up on a surface, as the spherical shape provides the minimum possible surface area. These attractive forces also cause the surface of the water to act like an elastic "skin" which allows things like insects to sit on the water's surface without sinking.

Table 5.1.2 Surface tensions of various liquids
| Liquid | Surface Tension (millinewton/meter) | Temperature oC |
|---|---|---|
| Mercury | 487.00 | 15 |
| Water | 71.97 | 25 |
| Glycerol | 63.00 | 20 |
| Acetone | 23.70 | 20 |
| Ethanol | 22.27 | 20 |
By Paul Webb, used under a CC-BY 4.0 international license. Download this book for free at https://rwu.pressbooks.pub/webboceanography/front-matter/preface/
The most dramatic examples of low pressure systems leading to storms and rain are hurricanes, cyclones, and typhoons. All three of these terms describe the same atmospheric processes and the same types of storms; it's just that different terminology is used in different parts of the world. In the Atlantic and Northeast Pacific, the storms are called hurricanes, in the Indian and South Pacific Oceans they are referred to as cyclones, and they are called typhoons in the Northwest Pacific.
Hurricanes begin as low pressure systems formed over warm, tropical water. They only form in tropical regions because they need the heat from the warm water to fuel the storm. The warm, moist air rises, cools, and condenses, forming rain, and the condensation releases more latent heat into the atmosphere. This heat causes even more air to rise and condense, further fueling the storm.
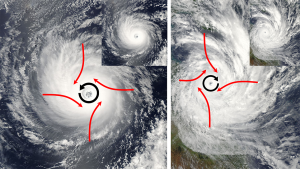
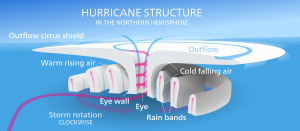
As the air rises towards the center of the storm, more warm tropical air rushes in to replace it, causing very strong winds. But the air does not move directly towards the center of the storm. Because of the large size of hurricanes, the air rushing towards the center will be deflected by the Coriolis Effect, causing the entire storm to rotate. In the Northern Hemisphere that deflection is to the right, causing Northern Hemisphere hurricanes to rotate counterclockwise. In the Southern Hemisphere, the winds are deflected to the left, leading to a clockwise rotation (Figure 6.4.1).
The violent winds characteristic of hurricanes are the result of the spiraling air that is moving towards the center of the storm, and once its winds exceed 74 mph the storm officially becomes a hurricane. At the very center of the hurricane, the pressure is so low that cool, dry air from the upper atmosphere get sucked downwards, leading to a central region of calm, clear skies; the hurricane's eye (Figure 6.4.2).
Hurricanes in the North Atlantic form as tropical storms over the warm water off of the African coast, and are moved east to west by the trade winds (Figure 6.4.3). As the storms move west over the tropical ocean, their energy increases until they reach hurricane status. As they approach the Caribbean, the Coriolis Effect deflects their path to the right, causing them to move towards the north (Figure 6.4.3). Eventually hurricanes might make landfall, causing extensive damage to coastal areas through the high winds, rain, and flooding. However, hurricanes often die out fairly soon after reaching land. When a storm moves over land it becomes cut off from the warm moist ocean air that has sustained it. Without that fuel source, the storm loses power and begins to dissipate.
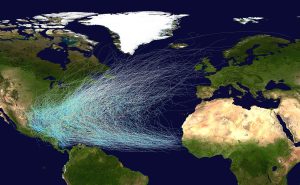
A similar pattern occurs in the Pacific and in the Southern Hemisphere. The trade winds move the storms from east to west, and they are deflected as they approach the coasts; to the right in the Northern Hemisphere and to the left in the Southern Hemisphere (Figure 6.4.4).

While the very high winds and intense rain of hurricanes can cause significant damage, in many cases it is the storm surge that leads to the most death and destruction. The storm surge is a "hill" of water that forms on the ocean surface below a hurricane. The surge is the result of two processes; a small hill is produced due to the extreme low pressure in the eye of a hurricane, which pulls water upwards towards the eye, creating a pressure surge. A larger surge is produced by the winds blowing and piling up water in the direction the storm is traveling (Figure 6.4.5). As the hurricane makes landfall, the effect of the storm surge is equivalent to a very large and sudden rise in sea level as the surge moves over the land, causing extensive flooding.

In 1970 the Bhola Cyclone struck Bangladesh with a 40 ft. storm surge, leading to the death of about 500,000 people, the deadliest hurricane in history. The east coast of the United States was hit by the New England Hurricane of 1938, which had a 16 ft. storm surge and left almost 700 people dead.
Preventing Storm Surge Damage
In response to the hurricane-related tragedies like those listed above, may cities have built hurricane barriers designed to reduce the flooding and damage associated with storm surges. Downtown Providence, Rhode Island, USA, was submerged under 13 feet of water during the Great New England hurricane of 1938, and was flooded again following Hurricane Carol in 1954. In the 1960s the Fox Point Hurricane Barrier was constructed at the mouth of the Providence River. It consists of a high wall with three "doors" that are left open under normal conditions, but can be closed during a hurricane to prevent a storm surge of up to 20.5 feet from inundating the city (Figure 6.4.6, left). A related concept is seen in the storm surge barrier on the Hollandse IJssel river in the Netherlands, where the barrier is lowered to prevent flooding (Figure 6.4.6, right).

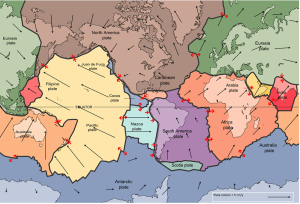
The idea of plate tectonics became widely accepted around 1965 as more and more geologists started thinking in these terms. By the end of 1967, Earth’s surface had been mapped into a series of plates (Figure 2.4.1). The major plates are Eurasia, Pacific, India, Australia, North America, South America, Africa, and Antarctic. There are also numerous small plates (e.g., Juan de Fuca, Nazca, Scotia, Philippine, Caribbean), and many very small plates or sub-plates. For example the Juan de Fuca Plate is actually three separate plates (Gorda, Juan de Fuca, and Explorer) that all move in the same general direction but at slightly different rates.
The fact that the plates include both crustal material and lithospheric mantle material makes it possible for a single plate to be made up of both oceanic and continental crust. For example, the North American Plate includes most of North America, plus half of the northern Atlantic Ocean. Similarly the South American Plate extends across the western part of the southern Atlantic Ocean, while the European and African plates each include part of the eastern Atlantic Ocean. The Pacific Plate is almost entirely oceanic, but it does include the part of California west of the San Andreas Fault.
Rates of motions of the major plates range from less than 1 cm/year to over 10 cm/year (for comparison, human fingernails grow at around 6 cm/year). The Pacific Plate is the fastest at over 10 cm/year in some areas, followed by the Australian and Nazca Plates. The North American Plate is one of the slowest, averaging around 1 cm/year in the south up to almost 4 cm/year in the north. Plates move as rigid bodies, so it may seem surprising that the North American Plate can be moving at different rates in different places. The explanation is that plates move in a rotational manner. The North American Plate, for example, rotates counter-clockwise; the Eurasian Plate rotates clockwise.
As originally described by Wegener in 1915, the present continents were once all part of the supercontinent Pangaea. More recent studies of continental match-ups and the magnetic ages of ocean-floor rocks have enabled us to reconstruct the history of the break-up of Pangaea.
Pangaea began to rift apart along a line between Africa and Asia and between North America and South America at around 200 Ma (Figure 2.4.2). During the same period, the Atlantic Ocean began to open up between northern Africa and North America, and India broke away from Antarctica. At this stage, Pangaea was divided into Laurasia (now Europe, Asia and North America) and Gondwanaland (the southern continents; South America, Africa, India, Australia, and Antarctica). Between 200 and 150 Ma, rifting started between South America and Africa and between North America and Europe, and India separated from Antarctica and moved north toward Asia. By 80 Ma, Africa had separated from South America, and most of Europe had separated from North America. By 50 Ma, Australia had separated from Antarctica, and shortly after that, India collided with Asia.
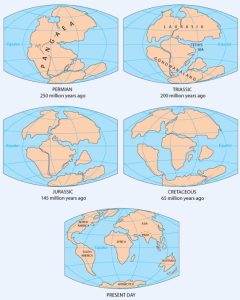
Over the next 50 million years, it is likely that there will be full development of the east African rift and creation of new ocean floor. Eventually Africa will split apart. There will also be continued northerly movement of Australia and Indonesia. The western part of California (including Los Angeles and part of San Francisco) will split away from the rest of North America, and eventually sail right by the west coast of Vancouver Island, en route to Alaska. Because the oceanic crust formed by spreading on the mid-Atlantic ridge is not currently being subducted (except in the Caribbean), the Atlantic Ocean is slowly getting bigger, and the Pacific Ocean is getting smaller. If this continues without changing for another couple hundred million years, we will be back to where we started, with one supercontinent.
Pangaea, which existed from about 350 to 200 Ma, was not the first supercontinent. In 1966, Tuzo Wilson proposed that there has been a continuous series of cycles of continental rifting and collision; that is, break-up of supercontinents, drifting, collision, and formation of other supercontinents. Pangaea was preceded by Pannotia (600 to 540 Ma), by Rodinia (1,100 to 750 Ma), and by other supercontinents before that.
With all of these plates constantly on the move, they inevitably end up interacting with each other at their plate boundaries. Plates can interact in three ways: they can move apart (divergent boundary), they can move towards each other (convergent boundary), or they can slide past each other (transform boundary). The following sections will examine each of these types of plate boundaries, and the geological features they create.
Additional links for more information:
- An interactive animation of plate motion over the past 550 million years: http://barabus.tru.ca/geol1031/plates.html
By Paul Webb, used under a CC-BY 4.0 international license. Download this book for free at https://rwu.pressbooks.pub/webboceanography/front-matter/preface/
Convergent boundaries, where two plates are moving toward each other, are of three types, depending on the type of crust present on either side of the boundary — oceanic or continental. The types are ocean-ocean, ocean-continent, and continent-continent.
At an ocean-ocean convergent boundary, one of the plates (oceanic crust and lithospheric mantle) is pushed, or subducted, under the other (Figure 2.6.1). Often it is the older and colder plate that is denser and subducts beneath the younger and warmer plate. There is commonly an ocean trench along the boundary as the crust bends downwards. The subducted lithosphere descends into the hot mantle at a relatively shallow angle close to the subduction zone, but at steeper angles farther down (up to about 45°). The significant volume of water within the subducting material is released as the subducting crust is heated. It mixes with the overlying mantle, and the addition of water to the hot mantle lowers the crust’s melting point and leads to the formation of magma (flux melting). The magma, which is lighter than the surrounding mantle material, rises through the mantle and the overlying oceanic crust to the ocean floor where it creates a chain of volcanic islands known as an island arc. A mature island arc develops into a chain of relatively large islands (such as Japan or Indonesia) as more and more volcanic material is extruded and sedimentary rocks accumulate around the islands. Earthquakes occur relatively deep below the seafloor, where the subducting crust moves against the overriding crust.
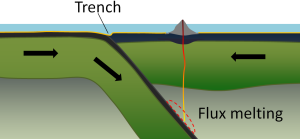
Examples of ocean-ocean convergent zones are subduction of the Pacific Plate south of Alaska (creating the Aleutian Islands) and under the Philippine Plate, where it creates the Marianas Trench, the deepest part of the ocean.
At an ocean-continent convergent boundary, the denser oceanic plate is pushed under the less dense continental plate in the same manner as at an ocean-ocean boundary. Sediment that has accumulated on the seafloor is thrust up into an accretionary wedge, and compression leads to thrusting within the continental plate (Figure 2.6.2). The magma produced adjacent to the subduction zone rises to the base of the continental crust and leads to partial melting of the crustal rock. The resulting magma ascends through the crust, producing a mountain chain with many volcanoes. As with an ocean-ocean boundary, the subducting crust can produce a deep trench running parallel to the coastline.
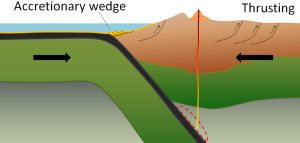
Examples of ocean-continent convergent boundaries are subduction of the Nazca Plate under South America (which has created the Andes Mountains and the Peru Trench) and subduction of the Juan de Fuca Plate under North America (creating the Cascade Range).
A continent-continent collision occurs when a continent or large island that has been moved along with subducting oceanic crust collides with another continent (Figure 2.6.3). The colliding continental material will not be subducted because it is too light (i.e., because it is composed largely of light continental rocks), but the root of the oceanic plate will eventually break off and sink into the mantle. There is tremendous deformation of the pre-existing continental rocks, forcing the material upwards and creating mountains.
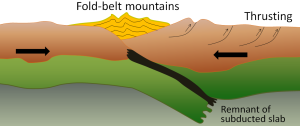
Examples of continent-continent convergent boundaries are the collision of the India Plate with the Eurasian Plate, creating the Himalaya Mountains, and the collision of the African Plate with the Eurasian Plate, creating the series of ranges extending from the Alps in Europe to the Zagros Mountains in Iran.
In the previous section we learned that rising air creates low pressure systems, and sinking air creates high pressure. In addition to their role in creating the surface winds, these high and low pressure systems also influence other climatic phenomena. Along the equator air is rising as it is warmed by solar radiation (section 6.2). Warm air contains more water vapor than cold air, which is why we experience humidity during the summer and not during the winter. The water content of air roughly doubles with every 10o C increase in temperature. So the air rising at the equator is warm and full of water vapor; as it rises into the upper atmosphere it cools, and the cool air can no longer hold as much water vapor, so the water condenses and forms rain. Therefore, low pressure systems are associated with precipitation, and we see wet habitats like tropical rainforests near the equator (Figure 6.3.1).
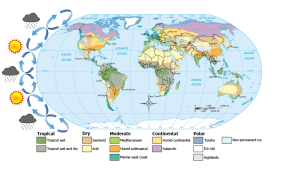
After rising and producing rain near the equator, the air masses move towards 30o latitude and sink back towards Earth as part of the Hadley convection cells. This air has lost most of its moisture after producing the equatorial rains, so the sinking air is dry, resulting in arid climates near 30o latitude in both hemispheres. Many of the major desert regions on Earth are located near 30o latitude, including much of Australia, the Middle East, and the Sahara Desert of Africa (Figure 6.3.1). The air also becomes compressed and heats up as it sinks, absorbing any moisture from the clouds and creating clear skies. Thus high pressure systems are associated with dry weather and clear skies. This cycle of high and low pressure regions continues with the Ferrel and Polar convection cells, leading to rain and the boreal forests at 60o latitude in the Northern Hemisphere (there are no corresponding large land masses at these latitudes in the Southern Hemisphere). At the poles, descending, dry air produces little precipitation, leading to the polar desert climate.
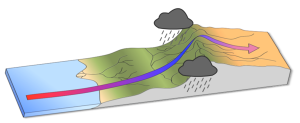
The elevation of the land also plays a role in precipitation and climactic characteristics. As moist air moves over land and encounters mountains it rises, expands, and cools because of the declining pressure and temperature. The cool air holds less water vapor, so condensation occurs and rain falls on the windward side of the mountains. As the air passes over the mountains to the leeward side, it is now dry air, and as it sinks the pressure increases, it heats back up, any moisture revaporizes, and it creates dry, deserts regions behind the mountains (Figure 6.3.2). This phenomenon is referred to as a rain shadow, and can be found in areas such as the Tibetan Plateau and Gobi Desert behind the Himalayas, Death Valley behind the Sierra Nevada mountains, and the dry San Joaquin Valley in California.
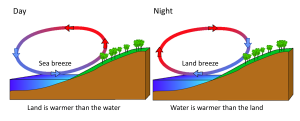
Rising and falling air are also responsible for more localized, short-term wind patterns in coastal areas. Due to the high heat capacity of water, land heats up and cools down about five times faster than water. During the day the sun heats up the land faster than it heats the water, setting up a convection cell of warmer rising air over the land and sinking cooler air over the water. This creates winds blowing from the water towards the land during the day and early evening; a sea breeze (Figure 6.3.3). The opposite occurs at night, when the land cools more quickly than the ocean. Now the ocean is warmer than the land, so air rises over the water and sinks over the land, creating a convection cell where winds blow from land towards the water. This is a land breeze, which blows at night and into the early morning (Figure 6.3.3).
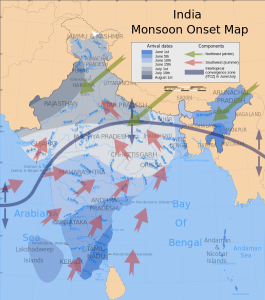
The same phenomenon leads to seasonal climatic changes in many areas. During the winter the lower pressure is over the warmer ocean, and the high pressure is over the colder land, so winds blow from land to sea. In summer the land is warmer than the ocean, causing low pressure over the land and winds to blow from the ocean towards the land. The winds blowing from the ocean contain a lot of water vapor, and as the moist air passes over land and rises, it cools and condenses causing seasonal rains, such as the summer monsoons of southeast Asia (Figure 6.3.4).
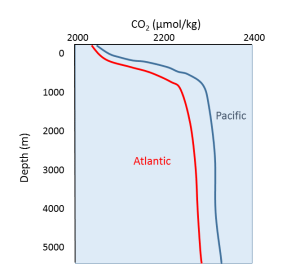
Oxygen and carbon dioxide are involved in the same biological processes in the ocean, but in opposite ways; photosynthesis consumes CO2 and produces O2, while respiration and decomposition consume O2 and produce CO2. Therefore it should not be surprising that oceanic CO2 profiles are essentially the opposite of dissolved oxygen profiles (Figure 5.5.1). At the surface, photosynthesis consumes CO2 so CO2 levels remain relatively low. In addition, organisms that utilize carbonate in their shells are common near the surface, further reducing the amount of dissolved CO2.
In deeper water, CO2 concentration increases as respiration exceeds photosynthesis, and decomposition of organic matter adds additional CO2 to the water. As with oxygen, there is often more CO2 at depth because cold bottom water holds more dissolved gases, and high pressures increase solubility. Deep water in the Pacific contains more CO2 than the Atlantic as the Pacific water is older and has accumulated more CO2 from the respiration of benthic organisms.
But the behavior of carbon dioxide in the ocean is more complex than the figure above would suggest. When CO2 gas dissolves in the ocean, it interacts with the water to produce a number of different compounds according to the reaction below:
CO2 + H2O ↔ H2CO3 ↔ H+ + HCO3- ↔ 2H+ + CO32-
CO2 reacts with water to produce carbonic acid (H2CO3), which then dissociates into bicarbonate (HCO3-) and hydrogen ions (H+). The bicarbonate ions can further dissociate into carbonate (CO32-) and additional hydrogen ions (Figure 5.5.2).
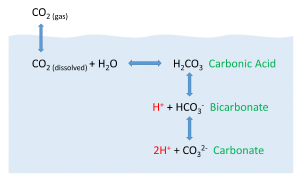
Most of the CO2 dissolving or produced in the ocean is quickly converted to bicarbonate. Bicarbonate accounts for about 92% of the CO2 dissolved in the ocean, and carbonate represents around 7%, so only about 1% remains as CO2, and little gets absorbed back into the air. The rapid conversion of CO2 into other forms prevents it from reaching equilibrium with the atmosphere, and in this way, water can hold 50-60 times as much CO2 and its derivatives as the air.
CO2 and pH
The equation above also illustrates carbon dioxide's role as a buffer, regulating the pH of the ocean. Recall that pH reflects the acidity or basicity of a solution. The pH scale runs from 0-14, with 0 indicating a very strong acid, and 14 representing highly basic conditions. A solution with a pH of 7 is considered neutral, as is the case for pure water. The pH value is calculated as the negative logarithm of the hydrogen ion concentration according to the equation:
pH = -log10[H+]
Therefore, a high concentration of H+ ions leads to a low pH and acidic condition, while a low H+ concentration indicates a high pH and basic conditions. It should also be noted that pH is described on a logarithmic scale, so every one point change on the pH scale actually represents an order of magnitude (10 x) change in solution strength. So a pH of 6 is 10 times more acidic than a pH of 7, and a pH of 5 is 100 times (10 x 10) more acidic than a pH of 7.
Carbon dioxide and the other carbon compounds listed above play an important role in buffering the pH of the ocean. Currently, the average pH for the global ocean is about 8.1, meaning seawater is slightly basic. Because most of the inorganic carbon dissolved in the ocean exists in the form of bicarbonate, bicarbonate can respond to disturbances in pH by releasing or incorporating hydrogen ions into the various carbon compounds. If pH rises (low [H+]), bicarbonate may dissociate into carbonate, and release more H+ ions, thus lowering pH. Conversely, if pH gets too low (high [H+]), bicarbonate and carbonate may incorporate some of those H+ ions and produce bicarbonate, carbonic acid, or CO2 to remove H+ ions and raise the pH. By shuttling H+ ions back and forth between the various compounds in this equation, the pH of the ocean is regulated and conditions remain favorable for life.
CO2 and Ocean Acidification
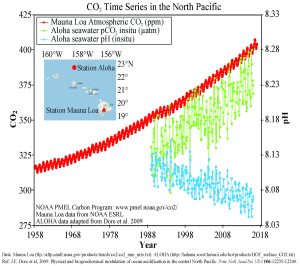
In recent years there has been rising concern about the phenomenon of ocean acidification. As described in the processes above, the addition of CO2 to seawater lowers the pH of the water. As anthropogenic sources of atmospheric CO2 have increased since the Industrial Revolution, the oceans have been absorbing an increasing amount of CO2, and researchers have documented a decline in ocean pH from about 8.2 to 8.1 in the last century. This may not appear to be much of a change, but remember that since pH is on a logarithmic scale, this decline represents a 30% increase in acidity. It should be noted that even at a pH of 8.1 the ocean is not actually acidic; the term "acidification" refers to the fact that the pH is becoming lower, i.e. the water is moving towards more acidic conditions.
Figure 5.5.3 presents data from observation stations in and around the Hawaiian Islands. As atmospheric levels of CO2 have increased, the CO2 content of the ocean water has also increased, leading to a reduction in seawater pH. Some models suggest that at the current rate of CO2 addition to the atmosphere, by 2100 ocean pH may be further reduced to around 7.8, which would represent more than a 120% increase in ocean acidity since the Industrial Revolution.
Why is this important? Declining pH can impact many biological systems. Of particular concern are organisms that secrete calcium carbonate shells or skeletons, such as corals, shellfish, and may planktonic organisms. At lower pH levels, calcium carbonate dissolves, eroding the shells and skeletons of these organisms (Figure 5.5.4).

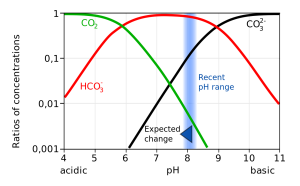
Not only does a declining pH lead to increased rates of dissolution of calcium carbonate, it also diminishes the amount of free carbonate ions in the water. The relative proportions of the different carbon compounds in seawater is dependent on pH (Figure 5.5.6). As pH declines, the amount of carbonate declines, so there is less available for organisms to incorporate into their shells and skeletons. So ocean acidification both dissolves existing shells and makes it harder for shell formation to occur.
Additional links for more information:
- NOAA Ocean Acidification Program website http://oceanacidification.noaa.gov/
Our modern understanding of tide formation stems from Isaac Newton's Law of Universal Gravitation, which states that any two objects have a gravitational attraction to each other. The magnitude of the force is proportional to the masses of the objects, and inversely proportional to the square of the distance between the objects, according to the equation in Figure 3.5.1.
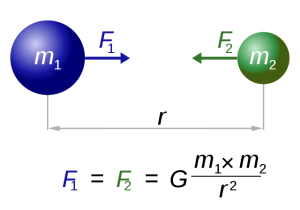
In the case of tides, there are a few other factors that modify this equation so that the distance (r) is cubed rather than squared, giving distance an even greater impact on tidal forces. But for our purposes, the important lesson is that the greater the masses of the objects, the greater the gravitational force, and the farther the objects are from each other, the weaker the force.
Such a gravitational force exists between the Earth and moon, attempting to pull them towards each other. Since the water covering Earth is fluid (unlike the solid land that is more resistant to tidal forces), this gravitational force pulls water towards the moon, creating a "bulge" of water on the side of the Earth facing the moon (Figure 3.5.2). This bulge always faces the moon, while the Earth rotates through it; the regions of Earth moving through the bulge experience a high tide, while those parts of the Earth away from the bulge experience a low tide.
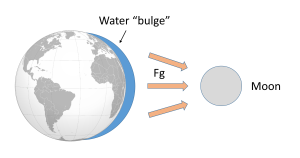
If the tides were this simple, everywhere on Earth would see one high tide per day, as there would only be a bulge of water on the side closest to the moon. However, if you have ever looked at tide charts, or lived near the ocean, you probably know that in most places there are two high tides and two low tides per day. Where is this second high tide "bulge" coming from?
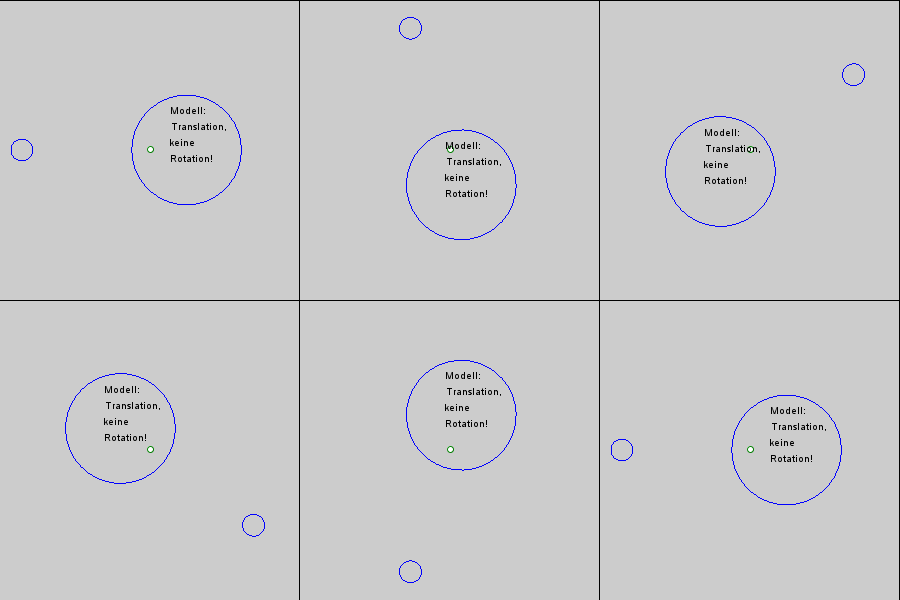
The gravitational force between the Earth and moon might be expected to draw the two objects closer together, however, this is not happening. This is because the inward gravitational force is opposed by outward forces that keep the Earth and moon apart. The outward force is an intertial force created by the rotation of the Earth and moon. Contrary to popular belief, the moon is not simply rotating around the Earth; in fact, the Earth and moon are both rotating around each other. Imagine the Earth and moon as equal-sized objects revolving around a point at their center of mass. If both objects had the same mass, the center of rotation would be a point equidistant between the two objects. But since the mass of the Earth is 82 times greater than the mass of the moon, the center of revolution must be closer to the Earth. As an analogy, think about two people on a see-saw. If the people are of roughly equal size, they can sit on either end of the see-saw at it will rotate around a point at equal distance between them. But if the two people have very different masses, such as a large adult and a small child, the larger person must move closer to the pivot point for the see-saw to rotate effectively. In the same way, the center of rotation between the Earth and the moon (the barycenter) must be located closer to the Earth. In fact, the center of rotation lies within the Earth, about 1600 km below the surface. As the Earth and moon rotate around the barycenter, the moon travels much farther than the Earth, giving the impression that the moon is rotating around Earth (Figure 3.5.3).
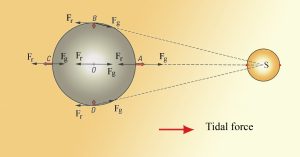
The rotation of the Earth-moon system creates an outward inertial force, which balances the gravitational force to keep the two bodies in their orbits. The inertial force has the same magnitude everywhere on Earth, and is always directed away from the moon. Gravitational force, on the other hand, is always directed towards the moon, and is stronger on the side of the Earth closest to the moon. Figure 3.5.4 describes how these forces combine to create the tidal forces. At point O in the center of the Earth, the gravitational force (Fg) and the inertial force (Fr) are equal, and cancel each other out. On the side of Earth closest to the moon, the inward gravitational force (Fg) is greater than the outward inertial force (Fr); the net resulting force (A) is directed towards the moon, and creates a bulge of water on the side facing the moon. On the side of Earth opposite the moon, the outward inertial force is greater than the inward gravitational force; the net resulting force (C) is directed away from the moon, creating a water bulge directed away from the moon.
Now, as the Earth rotates through a 24 hour day, each region passes through two bulges, and experiences two high tides and two low tides per day. This represents Newton's Equilibrium Theory of Tides, where there are two high tides and two low tides per day, of similar heights, each six hours apart. But as with everything else in oceanography, reality is much more complex than this idealized situation.
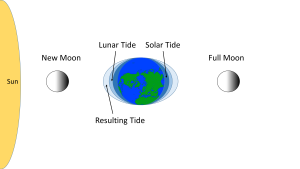
Some of the additional complexity is because in addition to the moon, the sun also exerts tide-affecting forces on Earth. The solar gravitational and inertial forces arise for the same reasons described above for the moon, but the magnitudes of the forces are different. The sun is 27 million times more massive than the moon, but it is 387 times farther away from the Earth. Despite its larger mass, because the sun is so much farther away than the moon, the sun's gravitational forces are only about half as strong as the moon's (remember that distance is cubed in the gravity equation). The sun thus creates its own, smaller water bulges, independent of the moon's, that contribute to the creation of tides.
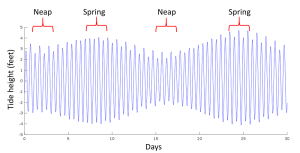
When the sun, Earth and moon are aligned, as occurs during new and full moons, the solar and lunar bulges are also aligned, and add to each other (constructive interference; see section 4.2) creating an especially high tidal range; high high tides and low low tides (Figure 3.5.5). This period of maximum tidal range is called a spring tide, and they occur every two weeks.
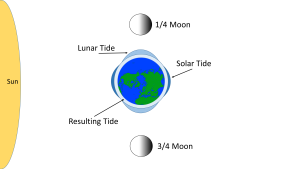
When the sun, Earth and moon are at 90o to each other, the solar and lunar bulges are out of phase, and cancel each other out (destructive interference). Now the tidal range is small, with low high tides and high low tides (Figure 3.5.6). These are neap tides, and occur every two weeks, when the moon is in its 1/4 and 3/4 phases (Figure 3.5.7).
By Paul Webb, used under a CC-BY 4.0 international license. Download this book for free at https://rwu.pressbooks.pub/webboceanography/front-matter/preface/

