7 2.1 Alfred Wegener and the Theory of Plate Tectonics
If you look at a map of Earth, you may notice that some of the continents seem to fit together. An early reference to this phenomenon came from Francis Bacon in the 17th century, who noticed the similarities in the Atlantic coasts of Africa, and North and South America. This apparent fit is due to the fact the continents were once connected, and have since moved apart in what has been called continental drift. However, we now know that it is not just the continents that move, so a more correct term is plate tectonics. We can credit Alfred Wegener (Figure 2.1.1) as the originator of this idea.
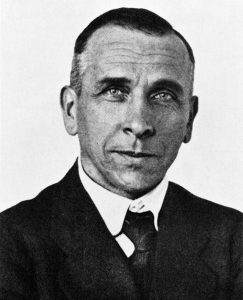
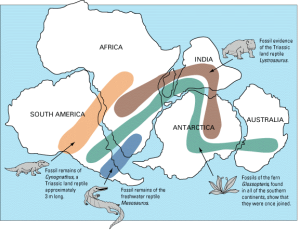
Alfred Wegener (1880-1930) earned a PhD in astronomy at the University of Berlin in 1904, but he had always been interested in geophysics and meteorology and spent most of his academic career working in meteorology. In 1911 he happened on a scientific publication that included a description of the existence of matching Permian-aged terrestrial fossils in various parts of South America, Africa, India, Antarctica, and Australia (Figure 2.1.2). Wegener concluded that this distribution of fossils could only exist if these continents were joined together. Furthermore, some of these transcontinental areas have similar fossils until around 150 million years ago, then they begin to diverge, suggesting that the areas eventually separated and speciation took different paths on the separate continents. Wegener coined the term Pangaea (“all land”) for the supercontinent from which all of the present-day continents diverged.
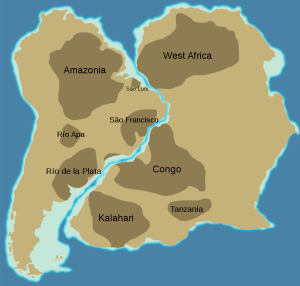
Wegener pursued his theory with determination — combing the libraries, consulting with colleagues, and making observations — looking for evidence to support it. In addition to the fit of the continents and the fossil evidence, Wegener relied heavily on matching geological patterns across oceans, such as sedimentary strata in South America matching those in Africa (Fig. 2.1.3), North American coalfields matching those in Europe, and the mountains of Atlantic Canada matching those of northern Britain both in morphology and rock type.
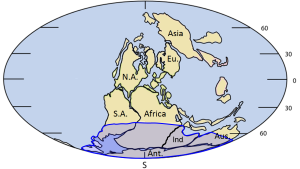
Wegener also referred to the evidence for the Carboniferous and Permian (~300 Ma) Karoo Glaciation in South America, Africa, India, Antarctica, and Australia (Fig. 2.1.4). These areas contain evidence of past glacial deposits, including glacial scars oriented away from the poles, despite the fact that some of these locations are now tropical environments. This indicates that these continents were once closer to the south pole where the glaciers could have formed. Wegener argued that this could only have happened if these continents were once all connected as a single supercontinent. He also cited evidence (based on his own astronomical observations) that showed that the continents were moving with respect to each other, and determined a separation rate between Greenland and Scandinavia of 11 m per year, although he admitted that the measurements were not accurate. In fact they weren’t even close — the separation rate is actually about 2.5 cm per year!
Wegener first published his ideas in 1912 in a short book called Die Entstehung der Kontinente (The Origin of Continents), and then in 1915 in Die Entstehung der Kontinente und Ozeane (The Origin of Continents and Oceans). He revised this book several times up to 1929, and it was translated into French, English, Spanish, and Russian. However, despite his range of evidence, the continental fits were not perfect and the geological match-ups were not always consistent (while the continental fit left some gaps when using the current coastline, it was demonstrated in the 1960s that using a 500 m depth contour gives a much tighter fit). But the most serious problem of all was that Wegener could not conceive of a good mechanism for moving the continents around. Wegener proposed that the continents were like icebergs floating on heavier crust, but the only forces that he could invoke to propel continents around were poleflucht, the effect of Earth’s rotation pushing objects toward the equator, and the lunar and solar tidal forces, which tend to push objects toward the west. It was quickly shown that these forces were far too weak to move continents, and without any reasonable mechanism to make it work, Wegener’s theory was quickly dismissed by most geologists of the day. Alfred Wegener died in Greenland in 1930 while carrying out studies related to glaciation and climate. At the time of his death, his ideas were tentatively accepted by only a small minority of geologists, and soundly rejected by most. However, within a few decades that was all to change.
Additional links for more information:
- For more about Wegener and the other pioneers of plate tectonics, visit The Geological Society’s Plate Tectonics site: https://www.geolsoc.org.uk/Plate-Tectonics/Chap1-Pioneers-of-Plate-Tectonics

Marine Reptiles
Marine reptiles are cold blooded (ectothermic), meaning that their internal temperature is regulated by their surroundings and is not constant. They have scales that cover their bodies, they reproduce out of the water, and they evolved from amphibians. Today's marine reptiles include turtles, sea snakes, iguanas, and marine crocodiles.
The first paragraph was written by Keddy (University of California, Davis), is shared under a not declared license and was authored, remixed, and/or curated by LibreTexts. Download this book for free at https://geo.libretexts.org/Courses/Diablo_Valley_College/OCEAN-101%3A_Fundamentals_of_Oceanography_(Keddy)
The rest was written by Dr. Cristina Cardona.
For most people, when they think of coastal areas they picture a beach, and the beach that they imagine is probably a typical sandy beach composed of quartz sand grains. But beaches are comprised of whatever types of sediments are dominant in the local area. For example, parts of Hawaii and Iceland are famous for their black sand beaches, made up of eroded basalt and other volcanic materials. The beautiful tropical white sand beaches we see in travel ads are largely composed of the crushed calcium carbonate remains of coral skeletons (much of which has been chewed up and excreted by a fish before we happily run our toes through it!) Other beaches may lack sand altogether and instead be dominated by small shells, or larger rocks or pebbles (Figure 4.1.1).
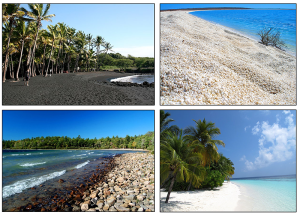
The shoreline is divided up into multiple zones (Figure 4.1.2). The backshore is the region of the beach above the high tide line, which is only submerged under unusually high wave conditions, such as during storms. The foreshore lies between the high tide and low tide lines; it is submerged during high tide and is exposed during low tide. The nearshore extends from the low tide line to the depth where wave action is no longer influenced by the bottom, i.e. to where the depth exceeds the wave base (section 3.1). Finally, the offshore zone represents the depths beyond the nearshore region.
Along the beach itself, the area above the high tide line is called the berm, which is usually dry and relatively flat. The berm often ends with a berm crest or berm scarp, which is a steeper wall carved out by wave action that leads down to the foreshore. The foreshore has a number of other names, including the beach face, the intertidal or littoral zone, and if the area is fairly flat, the low tide terrace. Just off shore from the beach there are often longshore bars and longshore troughs running parallel to the beach. The longshore bars are accumulations of sand that are deposited by wave action and longshore currents (section 4.2). The decrease in depth above longshore bars is what often causes waves to start to break well before reaching the beach (section 3.3).
The sand or other particles that make up the beach are distributed by wave action. The water that moves over a beach through incoming waves is called swash, and it also contains suspended sand grains that can get deposited on the beach. Some of the swash percolates into the sand while the rest of the water washes back out as backwash as the wave recedes. Backwash removes sand from the beach and returns it to the ocean. Sand will therefore be deposited or eroded depending on which process is dominant. If wave action is light, a lot of incoming water gets absorbed by the sand, so swash dominates. Under heavier waves the beach becomes saturated with water, so less can be absorbed, and backwash is dominant. This leads to seasonal cycles in beach structure; waves are heavier during the winter as a result of stormier conditions at sea, so backwash dominates and sand is removed from the beach and deposited offshore in longshore bars. In the summer the waves are gentler, swash dominates, and the sand is transported from the longshore bar and deposited on the shore to create a wider, sandy beach (Figure 4.1.3).

By Paul Webb, used under a CC-BY 4.0 international license. Download this book for free at https://rwu.pressbooks.pub/webboceanography/front-matter/preface/
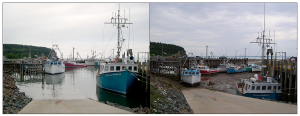
The Equilibrium Theory of tides predicts that each day there will be two high and two low tides, each one occurring at the same time day after day, with each pair producing tides of similar heights. While this view provides a basic explanation for the primary forces that generate the tides, it does not take into account such variables as the effects of the continents, the depth of the water, and many other factors. In all, there are almost 400 variables that must be incorporated into predicting the tides! The Dynamic Theory of tides takes these other factors into account, and shows that the tides are much more complicated and variable from place to place than the Equilibrium Theory would suggest. For example, some areas receive only one high and one low tide per day (see section 3.7). Furthermore, the tidal range varies greatly across the globe; in the Mediterranean Sea, there can be a difference of only 10 cm between high and low tides, while the Bay of Fundy in Canada experiences a tidal range of up to 17m (56 ft) every day (Figure 3.6.1).
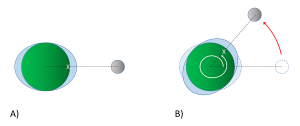
Examination of any tide chart will show that the tides don’t occur at same time each day; in fact, each tidal peak occurs about 50 minutes later than it did in the previous day. This is due to the orbit of the moon around the Earth. Imagine a high tide that occurs at a particular location (X) at 1:00 pm (Figure 3.6.2). The high tide occurs as location X moves through the bulge of water facing the moon. It will take the Earth 24 hours to complete one revolution, to bring location X back to site of the water bulge that caused that high tide. However, during those 24 hours, the moon has also moved as it orbits the Earth, so the high tide bulge has moved beyond its original location. The Earth thus has to rotate an additional distance for location X to reach the bulge and experience that same high tide. Because it takes the moon about 28 days to orbit the Earth, the moon gets "ahead" of the Earth's rotation by about 50 minutes per day. Therefore, it takes location X 24 hours and 50 minutes to rotate through the same tidal bulge, and as a result, the tidal peaks occur about 50 minutes later each day. In our example, an afternoon high tide at 1:00 pm on one day would be followed by a high tide at about 1:50 pm the following day. This 24 hour and 50 minute cycle is referred to as a tidal day.
The motion of the moon impacts the tidal cycles in other ways. As the moon orbits the Earth, its orbital plane is at an angle relative to the rotational plane of Earth. This angle, or declination, means than the moon fluctuates between an angle of 28.5o north of the equator, to 28.5o south of the equator roughly every two weeks (the cycle from maximum to minimum and back takes about 27 days). Figure 3.6.3 illustrates a case where the moon is at its maximum declination 28.5o north of the equator, creating its corresponding tidal maxima. A point on the Earth at the latitude indicated by the red line would experience two high tides as it rotated through 24 hours, at points A and B. But the two high tides would not be of equal heights; the high tide at A would be higher than the high tide at B. This helps create a mixed semi-diurnal tide; two high tides of different heights per day (see section 3.7).

Finally, the continents and the bottom topography of the oceans have an impact on the tides that are experienced in an area. Because the tides are essentially waves with extremely long wavelengths extending halfway across the Earth, they behave as shallow water waves, and they are influenced and refracted by the bottom contours, leading to regional tidal variations. When the tidal crests encounter land, they are are reflected, and the wave moves back out to sea, theoretically until it encounters another continent on the opposite side of the ocean basin. The crest is once again reflected, and the water oscillates back and forth as a standing wave across the ocean basin. However, because of the scale over which these tidal waves move, we must take into account the influence of the Coriolis Effect. As the tidal crest is reflected back across the ocean basin, its path is deflected by the Coriolis force; to the right in the Northern Hemisphere, and to the left in the Southern Hemisphere. Using the Northern Hemisphere as an example, imagine a tidal crest that has reached land on the western side of an ocean basin. It would have a tendency to be reflected and move across the basin towards the east. But the Coriolis force deflects the movement to the right, causing the crest to instead head south. When the crest hits land in the south, it would now tend to reflect towards the north, but once again the Coriolis deflection to the right kicks in, and the wave instead moves to the east. From the east the reflected wave is deflected to the north, and so on. The result of all of this is that instead of a simple standing wave moving back and forth across the ocean, the tidal crest follows a circular pattern around the ocean basin, counterclockwise in the Northern Hemisphere and clockwise in the Southern Hemisphere. This is analogous to shaking a pan full of water in a circular manner, and watching the water follow a similar circular path as it sloshes around inside. This large scale circular rotation pattern of tides is called amphidromic circulation (Figure 3.6.4). The rotation occurs around a central amphidromic point or node, that shows little tidal variation, while the largest tidal ranges occur on the edges of the circulation pattern. In Figure 3.6.4 the amphidromic points are indicated by the dark blue areas where the white lines converge, like spokes from a bicycle wheel, and the dark red and brown areas show the regions of maximum tidal heights. The tidal maxima will rotate around the amphidromic points, taking about 12 hours for a complete rotation, leading to two high and two low tides per day in many places. If a tidal maximum is occurring along one of the white lines in Figure 3.6.4 at a certain time in the Northern Hemisphere, one hour later that high tide will have moved to the white line to the left (counterclockwise), and so on until it completes a rotation. In the Southern Hemisphere, the tide will move to the line to the right for clockwise rotation.

The result of all of these variables is that the tides will not always occur twice each day, at the same time and with equal heights as the Equilibrium Theory of tides may suggest. Instead, each region of the oceans has a unique set of factors that contribute to the types of tides it will experience. The major types of tides are discussed in the next section.
By Paul Webb, used under a CC-BY 4.0 international license. Download this book for free at https://rwu.pressbooks.pub/webboceanography/front-matter/preface/
The surface currents we have discussed so far are ultimately driven by the wind, and since they only involve surface water they only affect about 10% of the ocean's volume. However, there are other significant ocean currents that are independent of the wind, and involve water movements in the other 90% of the ocean. These currents are driven by differences in water density.
Recall that less dense water remains at the surface, while denser water sinks. Waters of different densities tend to stratify themselves into layers, with the densest, coldest water on the bottom and warmer, less dense water on top. It is the movement of these density layers that create the deep water circulation. Since seawater density depends mainly on temperature and salinity (section 6.3), this circulation is referred to as thermohaline circulation.
The main processes that increase seawater density are cooling, evaporation, and ice formation. Evaporation and ice formation cause an increase in density by removing fresh water, leaving the remaining seawater with greater salinity (see section 5.3). The main processes that decrease seawater density are heating, and dilution by fresh water through precipitation, ice melting, or fresh water runoff. Note that all of these processes exert their effects at the surface, but don’t necessarily affect deeper water. However, changing the density of the surface water causes it to sink or rise, and these vertical, density-driven movements create the deep ocean currents. These thermohaline currents are slow, on the order of 10-20 km per year compared with surface currents that move at several kilometers per hour.
Water masses
A water mass is a volume of seawater with a distinctive density as a result of its unique profile of temperature and salinity. As stated above, the processes that affect seawater density really only happen at the surface. Once a water mass has reached its particular temperature and salinity profile due to these surface processes, it may sink below the surface, at which point its density properties won’t really change. We can therefore distinguish particular water masses by taking salinity and temperature measurements at different depths, and looking for the unique combination of these variables that give it its characteristic density. This is often carried out using temperature-salinity diagrams (T-S diagrams, see box below).
There are several well-known water masses in the ocean, particularly in the Atlantic, that are distinguished by their temperature and salinity characteristics. The densest ocean water is formed in two primary locations near the poles, where the water is very cold and highly saline as a result of ice formation. The densest deep water mass is formed in the Weddell Sea of Antarctica, and becomes the Antarctic Bottom Water (AABW). Similar processes in the North Atlantic produce the North Atlantic Deep Water (NADW) in the Greenland Sea (Figure 7.7.1).
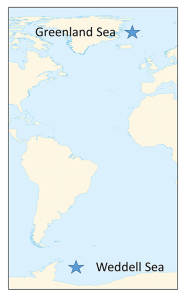
This cold, dense water sinks, and once it is removed from the surface, its temperature and salinity remain unchanged, so it keeps the same characteristics as it moves throughout the ocean as part of the thermohaline circulation. AABW sinks to the bottom in the Weddell Sea and then moves north along the bottom into the Atlantic, and east through the Southern Ocean. At the same time NADW is sinking in the Greenland Sea. This water mass is less dense than AABW and tends to form a layer above the AABW as it flows across the equator to the south (Figure 7.7.2). As the NADW moves towards the Antarctic continent, it is brought to the surface. Recall that near Antarctica there is the Antarctic divergence, where surface waters move horizontally away from each other, and are replaced by deep water upwelling (bringing nutrients to the surface and leading to high productivity; see section 8.3). Since polar water has a weak thermocline, there isn’t much of a density difference preventing the deep water from reaching the surface, so some NADW rises as part of the upwelling process (Figure 7.7.2).
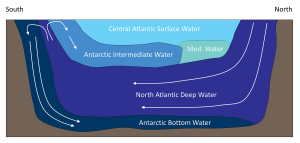
As the rising NADW reaches the surface, some travels south where it will eventually contribute to the production of new AABW. The NADW that moves north encounters the Antarctic convergence, which produces downwelling. This sinking NADW becomes a new water mass; Antarctic Intermediate Water (AAIW), which sinks and creates a layer between the surface water and the NADW (Figure 7.7.2). The surface water in the equatorial Atlantic, also called the Central Atlantic Surface Water, is very warm and low density, therefore it remains at the surface and does not contribute much to thermohaline circulation.
In the Atlantic, Mediterranean Intermediate Water (MIW) flows through the Straits of Gibraltar into the open ocean. This water is warm and salty from the warm temperatures and high evaporation characteristic of the Mediterranean Sea, so it is denser than the normal surface water and forms a layer about 1-1.5 km deep. Eventually this water will move north to the Greenland Sea, where it will be cooled and will sink, becoming the dense NADW.
T-S Diagrams
A temperature-salinity (T-S) diagram is used to examine how temperature, salinity, and density change with depth, and to identify the vertical structure of the water column, including the water masses it contains. Water temperature is on the y-axis, and salinity appears on the x-axis. Often, instead of the actual temperature of the water, oceanographers plot potential temperature, which is the temperature the water would achieve if it was brought to the surface and did not get any additional heat through compression at depth. A T-S diagram shows lines of equal density, or isopycnals, for various combinations of temperature and salinity (Figure 7.7.3). You can then plot the values of temperature and salinity on the diagram, and use their point of intersection to calculate the density of the water. In the example in Figure 7.7.3 a temperature of about 11o C and a salinity of 34.6 PSU results in a density of 1.0265 g/cm3.
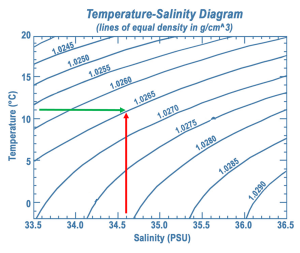
Since the range of densities in the ocean is rather small, often the density value is shortened and is expressed as sigma-t or σt. Sigma-t is calculated as: (density – 1) x 1000. So it essentially just looks at the last three decimal places of the density value. Thus a density of 1.0275 g/cm3 would have a σt of 27.5.
T-S diagrams can be used to identify water masses. Since each major water mass has its own characteristic range of temperatures and salinities, a deep water sample that falls into that range can presumably have come from that water mass. Figure 7.7.4 shows the typical range of temperature and salinity for the major Atlantic water masses.
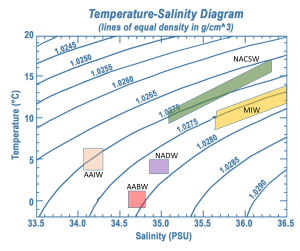
To investigate water masses, oceanographers can take a series of temperature and salinity measurements over a range of depths at a particular location. If the water column was highly stratified and there was no mixing between or within the layers, as the probe was lowered your would get a series of constant temperature and salinity readings as you moved through the first water mass, followed by a sudden jump to another set of different but constant readings as you moved through the next water mass. Plotting temperature vs. salinity on a T-S diagram would result in a distinct and independent point for each water mass. However, in reality, the water masses will show some mixing within and between layers. So as the probes are lowered, they will encounter water that shows traits intermediate between the two points. Therefore, with increasing depth, the points on the T-S diagram will gradually move from one point to the other, creating a line connecting the two points, illustrating mixing between those two water masses.
In the example in Figure 7.7.5, NACSW is present at the surface (0 m depth), and between 0 and about 800 m there is a transition from NACSE into AAIW. Between about 800-2100 m there is a transition from AAIW into the NADW layer just beyond 2000 m. AABW is the deepest water mass, at depths of about 4000 m. The transition between NADW and AABW occurs between about 2100-4000 m.
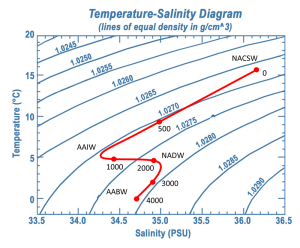
Notice that as the recordings get deeper in Figure 7.7.5, the density is always increasing (i.e. moving towards the bottom right corner). This is because the densest water should be located at the bottom, with the other layers stratified according to their density, otherwise the water column would be unstable.
The "Ocean Conveyor Belt"
The bottom water from the Weddell Sea and Greenland Sea does not just circulate through the Atlantic. NADW moves south through the western Atlantic before meeting the AABW north of the Weddell Sea. Together these water masses move eastwards into the Indian and Pacific Oceans. By this time the NADW and AABW have started mixing, to create what is called Common Water. The deep Common Water moves northwards into the Pacific and Indian Oceans and gradually mixes with the warmer water, causing it to eventually rise to the surface. As surface water, it makes its way back to the North Atlantic through the surface currents of the Pacific and Indian Oceans. Once back in the North Atlantic, it cools and once again forms NADW, starting the process anew. This cycle of rising and sinking water transporting water between the surface and deep circulation has been referred to as the global oceanic "conveyor belt", and may take about 1000-2000 years to complete (Figure 7.7.6).

This global circulation pattern has a number of important implications for Earth's environment. For one, it is vital to the transport of heat around the globe, bringing warm water towards the poles, and cold water to the tropics, stabilizing temperature in both environments.
The conveyor belt also helps deliver oxygen to deep water habitats. The deep water began as cold surface water that was saturated with oxygen, and when it sank it brought that oxygen to depth. Thermohaline circulation carries this oxygen-rich deep water throughout the oceans, where the oxygen will be used by deep water organisms. Bottom water in the Atlantic is relatively high in oxygen, as it still retains much of its original oxygen content, but as it travels over the seafloor the oxygen is used up, so that deep water in the Pacific Ocean has much less oxygen than deep Atlantic water, with Indian Ocean water somewhere in between. At the same time, deep water will accumulate nutrients as organic matter sinks and decomposes. Atlantic bottom water is low in nutrients because it has not had much time to accumulate them, and the original surface water was nutrient-poor. By the time this bottom water reaches the Indian Ocean, and after that the Pacific, it has been accumulating the sinking nutrients for centuries, so deep nutrient concentrations are greater in the Pacific than the Atlantic. We can therefore use the ratios of oxygen to nutrients in the deep water to tell the relative age of a water mass, i.e. how long it has been since it sank from the surface. Younger bottom water should be high in oxygen and low in nutrients, while the opposite would be expected for older bottom water.
The ocean conveyor belt may be significantly impacted by climate change disrupting thermohaline circulation. Increased warming, particularly in the Arctic, could lead to continuing melting of the polar ice caps, adding a large amount of fresh water to the polar surface water. This input of fresh water could create a low density, low salinity surface layer of water that no longer sinks, thus disrupting the deep circulation conveyor belt and preventing oxygen and nutrient transport to bottom communities. The sinking of seawater in the Greenland Sea also helps drive the Gulf Stream; as water sinks, more surface water is pulled northwards in the Gulf Stream. If this polar water stops sinking the Gulf Stream could weaken, reducing heat transport to the poles and cooling the northern climate. It seems counter intuitive, but global warming could lead to colder conditions in Europe and the freezing of ports and cities that are usually ice-free due to the warming effects of the Gulf Stream. Recent evidence has already shown that the strength of the Gulf Stream is waning, likely due to the increased melting of Arctic ice.

