6 1.6 Determining the Structure of Earth
The previous section described the properties and composition of Earth’s interior, which begs the question: how can we know what conditions are like deep in the Earth? It’s easy to sample the crust through drilling, and mantle material often comes to the surface as magma, but the farthest we have been able to drill into the crust so far is only about 12 km; this for a planet with a radius of 6370 km! So to understand the composition and structure of the Earth’s deep interior, we need to use indirect methods such as seismology.
Seismology is the study of vibrations within the Earth. These vibrations are caused by various events, including earthquakes, extraterrestrial impacts, explosions, storm waves hitting the shore, and tidal effects. Of course, seismic techniques have been most widely applied to the detection and study of earthquakes, but there are many other applications, and arguably seismic waves provide the most important information that we have concerning Earth’s interior. Before going any deeper into Earth, however, we need to take a look at the properties of seismic waves. The types of waves that are useful for understanding Earth’s interior are called body waves, meaning that, unlike the surface waves on the ocean, they are transmitted through Earth materials.
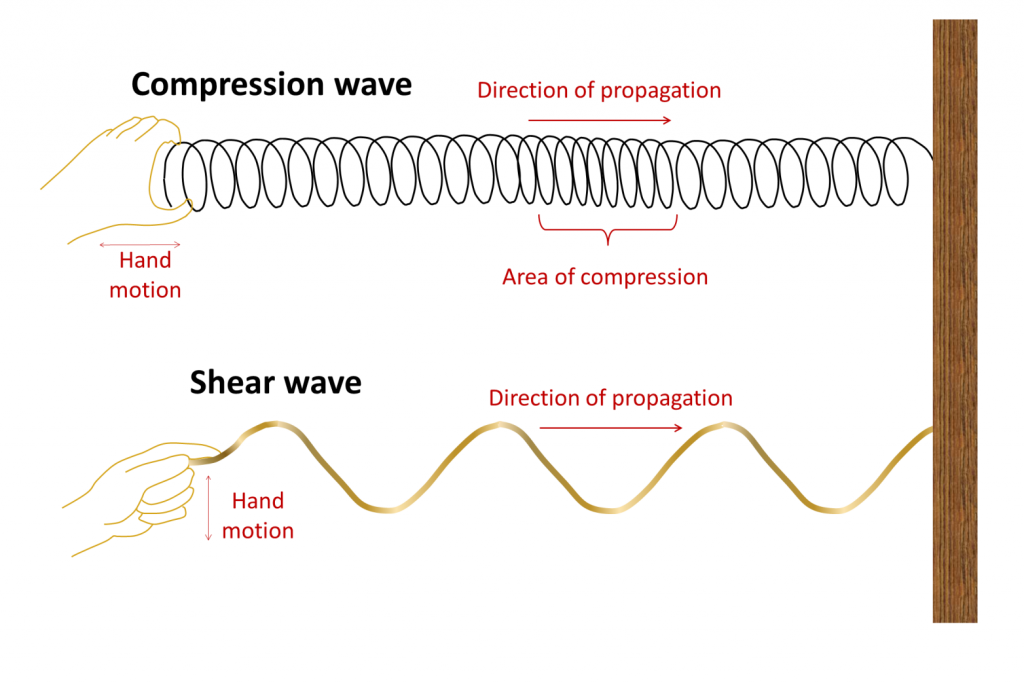
Imagine hitting a large block of strong rock (e.g., granite) with a heavy sledgehammer. At the point where the hammer strikes it, a small part of the rock will be compressed by a fraction of a millimeter. That compression will transfer to the neighboring part of the rock, and so on through to the far side of the rock, from where it will bounce back to the top — all in a fraction of a second. This is known as a compression wave, and it can be illustrated by holding a loose spring (like a Slinky) that is attached to something (or someone) at the other end. If you give it a sharp push so the coils are compressed, the compression propagates (travels) along the length of the spring and back (Fig. 1.6.1). You can think of a compression wave as a “push” wave — it’s called a P-wave (although the “P” stands for “primary” because P-waves are the first to arrive at seismic stations). In a P-wave the motion of the particles is parallel to the direction of wave propagation.
When we hit a rock with a hammer, we also create a different type of body wave, one that is characterized by back-and-forth vibrations (as opposed to compressions). This is known as a shear wave (S-wave, where the “S” stands for “secondary”), and an analogy would be what happens when you flick a length of rope with an up-and-down motion. As shown in Figure 1.6.1, a wave will form in the rope, which will travel to the end of the rope and back. In this case, the motion of the particles is perpendicular to the direction the wave travels.
Compression waves and shear waves travel very quickly through geological materials. As shown in Figure 1.6.2, typical P-wave velocities are between 0.5 km/s and 2.5 km/s in unconsolidated sediments, and between 3.0 km/s and 6.5 km/s in solid crustal rocks. Of the common rocks of the crust, velocities are greatest in basalt and granite. S-waves are slower than P-waves, with velocities between 0.1 km/s and 0.8 km/s in soft sediments, and between 1.5 km/s and 3.8 km/s in solid rocks.
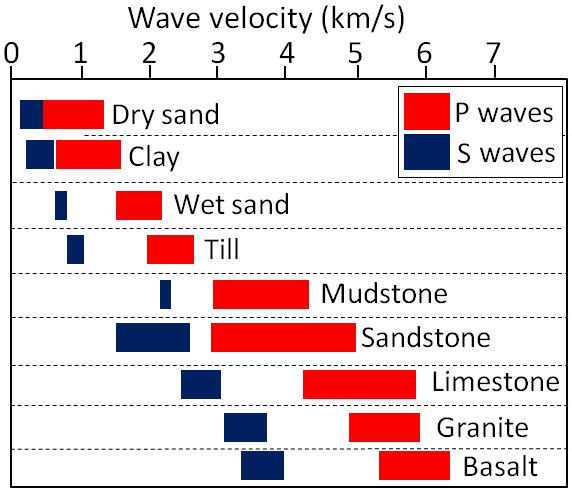
Mantle rock is generally denser and stronger than crustal rock and both P- and S-waves travel faster through the mantle than they do through the crust. Moreover, seismic-wave velocities are related to how tightly compressed a rock is, and the level of compression increases dramatically with depth. Finally, seismic waves are affected by the phase state of rock. They are slowed if there is any degree of melting in the rock. If the material is completely liquid, P-waves are slowed dramatically and S-waves are stopped altogether.
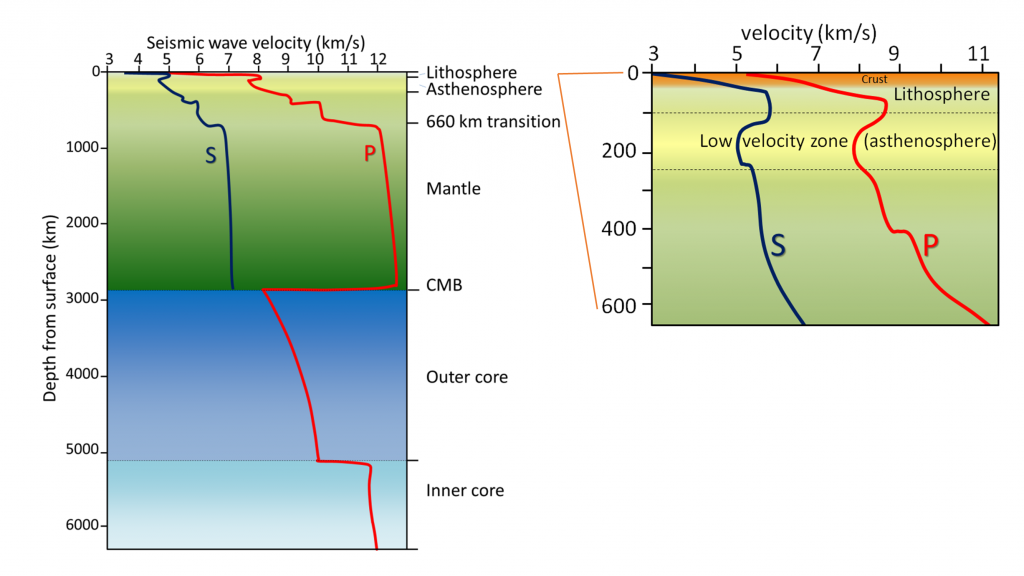
Accurate seismometers have been used for earthquake studies since the late 1800s, and systematic use of seismic data to understand Earth’s interior started in the early 1900s. The rate of change of seismic waves with depth in the Earth (Fig. 1.6.3) has been determined over the past several decades by analyzing seismic signals from large earthquakes at seismic stations around the world. Small differences in arrival time of signals at different locations have been interpreted to show that:
- Velocities are greater in mantle rock than in the crust.
- Velocities generally increase with pressure, and therefore with depth.
- Velocities slow in the area between 100 km and 250 km depth (called the “low-velocity zone”; equivalent to the asthenosphere).
- Velocities increase dramatically at 660 km depth (because of a mineralogical transition).
- Velocities slow in the region just above the core-mantle boundary (the D” layer or “ultra-low-velocity zone”).
- S-waves do not pass through the outer part of the core.
- P-wave velocities increase dramatically at the boundary between the liquid outer core and the solid inner core.
One of the first discoveries about Earth’s interior made through seismology was in the early 1900s when Croatian seismologist Andrija Mohorovičić (pronounced Moho-ro-vi-chich) realized that at certain distances from an earthquake, two separate sets of seismic waves arrived at a seismic station within a few seconds of each other. He reasoned that the waves that went down into the mantle, traveled through the mantle, and then were bent upward back into the crust, reached the seismic station first because although they had farther to go, they traveled faster through mantle rock (as shown in Figure 1.6.4). The boundary between the crust and the mantle is known as the Mohorovičić discontinuity (or Moho). Its depth is between 60 km and 80 km beneath major mountain ranges, around 30 km to 50 km beneath most of the continental crust, and between 5 km and 10 km beneath the oceanic crust.

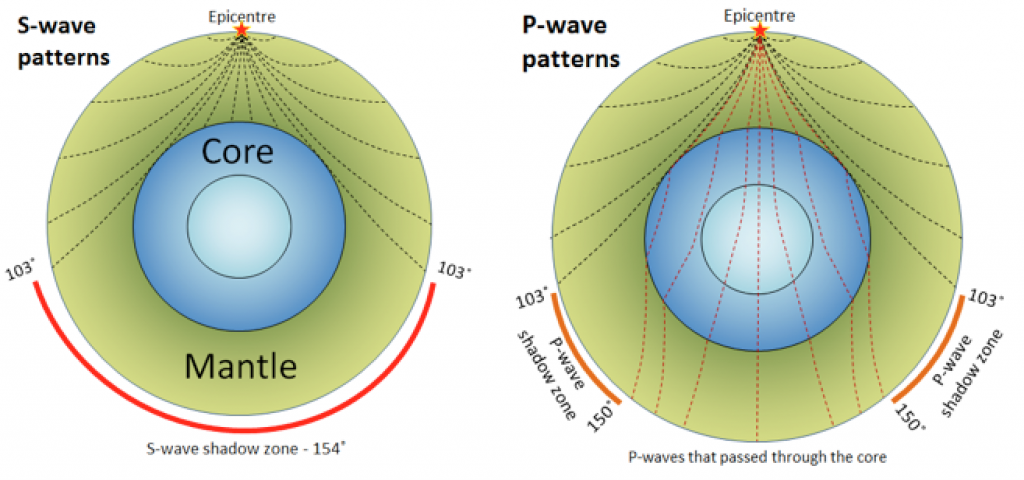
Our current understanding of the patterns of seismic wave transmission through Earth is summarized in Figure 1.6.5. Because of the gradual increase in density with depth, all waves are refracted toward the lower density, slower velocity material as they travel through homogenous parts of Earth, and thus tend to curve outward toward the surface. Waves are also refracted at boundaries within Earth, such as at the Moho, at the core-mantle boundary (CMB), and at the outer-core/inner-core boundary. S-waves do not travel through liquids — they are stopped at the CMB — and there is an S-wave shadow on the side of Earth opposite a seismic source. The angular distance from the seismic source to the shadow zone is 103° on either side, so the total angular distance of the shadow zone is 154°. We can use this information to infer the depth to the CMB. P-waves do travel through liquids, so they can make it through the liquid part of the core. Because of the refraction that takes place at the CMB, waves that travel through the core are bent away from the surface, and this creates a P-wave shadow zone on either side, from 103° to 150°. This information can be used to discover the differences between the inner and outer parts of the core.
Using data from many seismometers and hundreds of earthquakes, it is possible to create a two- or three-dimensional image of the seismic properties of part of the mantle. This technique is known as seismic tomography, and an example of the result is shown in Figure 1.6.6.
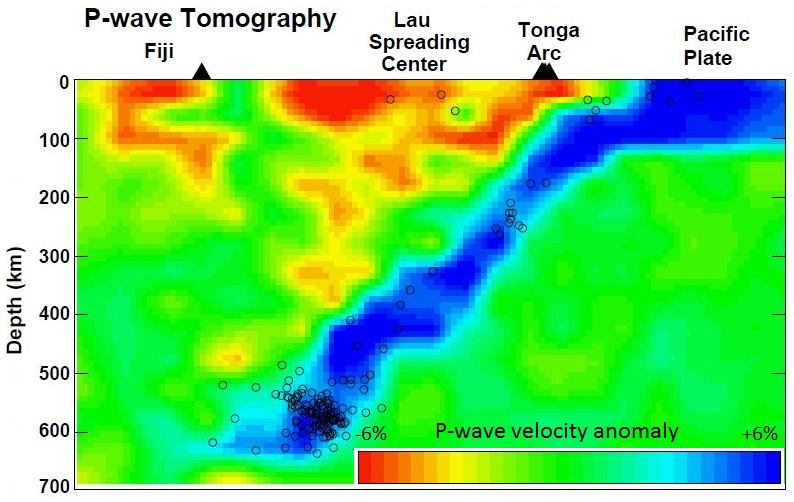
The Pacific Plate subducts beneath Tonga and appears in Figure 1.6.6 as a 100 km thick slab of cold (blue-colored) oceanic crust that has pushed down into the surrounding hot mantle. The cold rock is more rigid than the surrounding hot mantle rock, so it is characterized by slightly faster seismic velocities. There is volcanism in the Lau spreading center and also in the Fiji area, and the warm rock in these areas has slower seismic velocities (yellow and red colors).
Seismic waves provide us with the structure of the inner Earth, but what about it’s other properties? In terms of composition, there are several lines of evidence pointing to a core composed mostly of iron and nickel. Wave properties suggest the core is composed of an element with an atomic number around 25 (iron has an atomic number of 26). Aside from iron, all of the other elements with an atomic number close to 25 are too rare to make up the core. If the Earth was formed through the accretion of smaller bodies such as meteorites, we would expect the composition of Earth to be similar to the composition of meteorites. Meteorites are mostly iron and nickel, but in higher proportions than the Earth’s crust. This suggests that most of this heavy iron and nickel from the meteorites must have sunk to the Earth’s center as the planet was forming. However, the core is not dense enough to be pure iron and nickel; it it about 10% below the predicted density if that was the case. This is why scientists believe the core is composed of about 10% sulfur, oxygen, and hydrogen. Finally, if the Earth’s magnetic field comes from the fluid outer core, the outer core must contain iron. In terms of the temperatures, we can calculate the melting points of these materials over the range of pressures that they would experience in the inner Earth, and then infer the temperatures that would allow these elements to exist in their solid or liquid forms.
Written by Dr. Cristina Cardona.
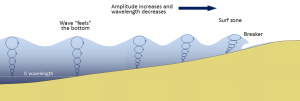
Most of the waves discussed in the previous section referred to deep water waves in the open ocean. But what happens when these waves move towards shore and encounter shallow water? Remember that in deep water, a wave’s speed depends on its wavelength, but in shallow water wave speed depends on the depth (section 3.1). When waves approach the shore they will "touch bottom" at a depth equal to half of their wavelength; in other words, when the water depth equals the depth of the wave base (Figure 3.3.1). At this point their behavior will begin to be influenced by the bottom.
When the wave touches the bottom, friction causes the wave to slow down. As one wave slows down, the one behind it catches up to it, thus decreasing the wavelength. However, the wave still contains the same amount of energy, so while the wavelength decreases, the wave height increases. Eventually the wave height exceeds 1/7 of the wavelength, and the wave becomes unstable and forms a breaker. Often breakers will start to curl forwards as they break. This is because the bottom of the wave begins to slow down before the top of the wave, as it is the first part to encounter the seafloor. So the crest of the wave gets “ahead” of the rest of the wave, but has no water underneath it to support it (Figure 3.3.1).
There are three main types of breakers: spilling, plunging, and surging. These are related to the steepness of the bottom, and how quickly the wave will slow down and its energy will get dissipated.
- Spilling breakers form on gently sloping or flatter beaches, where the energy of the wave is dissipated gradually. The wave slowly increases in height, then slowly collapses on itself (Figure 3.3.2). For surfers, these waves provide a longer ride, but they are less exciting.

- Plunging breakers form on more steeply-sloped shores, where there is a sudden slowing of the wave and the wave gets higher very quickly. The crest outruns the rest of the wave, curls forwards and breaks with a sudden loss of energy (Figure 3.3.3). These are the “pipeline” waves that surfers seek out.

- Surging breakers form on the steepest shorelines. The wave energy is compressed very suddenly right at the shoreline, and the wave breaks right onto the beach (Figure 3.3.4). These waves give too short (and potentially painful) a ride for surfers to enjoy.

Wave Refraction
Swell can be generated anywhere in the ocean and therefore can arrive at a beach from almost any direction. But if you have ever stood at the shore you have probably noticed that the waves usually approach the shore somewhat parallel to the coast. This is due to wave refraction. If a wave front approaches shore at an angle, the end of the wave front closest to shore will touch bottom before the rest of the wave. This will cause that shallower part of the wave to slow down first, while the rest of the wave that is still in deeper water will continue on at its regular speed. As more and more of the wave front encounters shallower water and slows down, the wave font refracts and the waves tend to align themselves nearly parallel to the shoreline (they are refracted towards the region of slower speed). As we will see in section 5.2, the fact that the waves do not arrive perfectly parallel to the beach causes longshore currents and longshore transport that run parallel to the shore.
Refraction can also explain why waves tend to be larger off of points and headlands, and smaller in bays. A wave front approaching shore will touch the bottom off of the point before it touches bottom in a bay. Once again, the shallower part of the wave front will slow down, and cause the rest of the wave front to refract towards the slower region (the point). Now all of the initial wave energy is concentrated in a relatively small area off of the point, creating large, high energy waves (Figure 3.3.6). In the bay, the refraction has caused the wave fronts to refract away from each other, dispersing the wave energy, and leading to calmer water and smaller waves. This makes the large waves of a “point break” ideal for surfing, while water is calmer in a bay, which is where people would launch a boat. This difference in wave energy also explains why there is net erosion on points, while sand and sediments get deposited in bays (see section 5.3).

By Paul Webb, used under a CC-BY 4.0 international license. Download this book for free at https://rwu.pressbooks.pub/webboceanography/front-matter/preface/
All of the salts and ions that dissolve in seawater contribute to its overall salinity. Salinity of seawater is usually expressed as the grams of salt per kilogram (1000 g) of seawater. On average, about 35 g of salt is present in each 1 kg of seawater, so we say that the average salinity of the ocean salinity is 35 parts per thousand (ppt). Note that 35 ppt is equivalent to 3.5% (parts per hundred). Some sources now use practical salinity units (PSU) to express salinity values, where 1 PSU = 1 ppt. The units are not included, so we can refer simply to a salinity of 35.
Many different substances are dissolved in the ocean, but six ions comprise about 99.4% of all the dissolved ions in seawater. These six major ions are (Table 5.3.1):
Table 5.3.1 The six major ions in seawater
| g/kg in seawater | % of ions by weight | |
|---|---|---|
| Chloride Cl- | 19.35 | 55.07% |
| Sodium Na+ | 10.76 | 30.6% |
| Sulfate SO42- | 2.71 | 7.72% |
| Magnesium Mg2+ | 1.29 | 3.68% |
| Calcium Ca2+ | 0.41 | 1.17% |
| Potassium K+ | 0.39 | 1.1% |
| 99.36% |

Chloride and sodium, the components of table salt (sodium chloride NaCl), make up over 85% of the ions in the ocean, which is why seawater tastes salty (Figure 5.3.1). In addition to the major constituents, there are numerous minor constituents; radionucleotides, organic compounds, metals etc. These minor constituents are found in concentrations of ppm (parts per million) or ppb (parts per billion), unlike the major ions that are far more abundant (ppt) (Table 5.3.2). To put this into perspective, 1 ppm = 1 mg/kg, or the equivalent of 1 teaspoon of sugar dissolved in 14,000 cans of soda. 1 ppb = 1 μg/kg, or the equivalent of 1 teaspoon of a substance dissolved in five Olympic-sized swimming pools! These minor constituents represent numerous substances, but together they make up less than 1% of the ions in the seawater. Some of these may be important as minerals and trace elements vital to living organisms, but they don’t have much impact on the overall salinity. But given the vast size of the oceans, even materials found in trace abundance can represent fairly large reservoirs. For example gold is a trace element in seawater, found in concentrations of parts per trillion, yet if you could extract all of the gold in just one km3 of seawater, it would be worth about $20 million!
Table 5.3.2 Concentrations of some minor elements in seawater
| g/kg in seawater | g/kg in seawater | ||
|---|---|---|---|
| Carbon | 0.028 | Iron | 2 x 10⁻⁶ |
| Nitrogen | 0.0115 | Manganese | 2 x 10⁻⁷ |
| Oxygen | 0.006 | Copper | 1 x 10⁻⁷ |
| Silicon | 0.002 | Mercury | 3 x 10⁻⁸ |
| Phosphorous | 6 x 10⁻⁵ | Gold | 4 x 10⁻⁹ |
| Uranium | 3.2 x 10⁻⁶ | Lead | 5 x 10⁻¹⁰ |
| Aluminum | 2 x 10⁻⁶ | Radon | 6 x 10-19 |
Because the six major ions in seawater comprise over 99% of the total salinity, changes in abundance of the minor constituents have little effect on overall salinity. Furthermore, the rule of constant proportions states that even though the absolute salinity of ocean water might differ in different places, the relative proportions of the six major ions within that water are always constant. For example, no matter the total salinity of a seawater sample, 55% of the total salinity will be due to chloride, 30% due to sodium, and so on. Since the proportion of these major ions does not change, we call these conservative ions.
Given these constant proportions, in order to calculate total salinity you can simply measure the concentration of just one of the major ions and use that value to calculate the rest. Traditionally chloride has been the ion measured because it is the most abundant, and thus the simplest to measure accurately. Multiplying the concentration of chloride by 1.8 gives the total salinity. For example, looking at Figure 5.3.1, 19.25 g/kg (ppt) chloride x 1.8 = 35 ppt. Today, for rapid measurements of salinity, electrical conductivity is often used rather than determining chloride concentrations (see box below).
Measuring salinity
There are a number of methods available for measuring the salinity of water. The most precise measurements utilize direct chemical analysis of the seawater in a lab setting, but there are a number of ways to get immediate salinity measurements in the field. For a quick estimate of salinity, a hand-held refractometer can be used (right).

This instrument measures the degree of bending, or refraction, of light rays as they pass through a fluid. The greater the amount of dissolved salts in the sample, the greater the degree of light refraction. The observer traps a drop of water on the blue screen, and looks through the eyepiece. The dividing line between the blue and white sections of the scale (inset) can be used to read the salinity.
For more accurate measurements, most oceanographers use an instrument that measures electrical conductivity. An electrical current is passed between two electrodes immersed in water, and the higher the salinity, the more readily the current will be conducted (the ions in seawater conduct electrical currents). Conductivity probes are often bundled into an instrument called a CTD, which stands for Conductivity, Temperature, and Depth, which are the most commonly-measured parameters. Modern CTDs can be outfitted with an array of probes measuring parameters like light, turbidity (water clarity), dissolved gases etc. CTDs can be large instruments (below), but small hand-held salinity probes are also widely available.

For large-scale salinity measurements, oceanographers can use satellites, such as the Aquarius satellite, which was able to measure surface salinity differences as small as 0.2 PSU as it mapped the ocean surface every seven days (below).
It is important to be aware that while the rule of constant proportions applies to most of the ocean, there may be certain coastal areas where lots of river discharge may alter these proportions slightly. Furthermore, it is important to remember that the rule of constant proportions only applies to the major ions. The proportions of the minor ions may fluctuate, but remember that they make a very minor contribution to overall salinity. Because the concentrations of the minor ions are not constant, these are referred to as non-conservative ions.
Why are the major ions found in constant proportions? There is constant input of ions from river runoff and other processes, usually in very different proportions from what is found in the ocean. So why don’t the proportions in the oceans change? Most of the ions discharged by rivers have fairly low residence times (see section 5.2) compared to ions in seawater, usually because they are used in biological processes. These low residence times do not allow the ions to accumulate and alter salinity. Also, the mixing time of the world ocean is around 1000 years, which is very short compared to the residence times of the major ions, which may be tens of millions of years long. So during the residence time of a single ion the ocean has mixed numerous times, and the major ions have become evenly distributed throughout the ocean.
Variations in Salinity
Total salinity in the open ocean averages 33-37 ppt, but it can vary significantly in different locations. But since the major ion proportions are constant, the regional salinity differences must be due more to water input and removal rather than the addition or removal of ions. Fresh water input comes through processes like precipitation, runoff from land, and melting ice. Fresh water removal primarily comes from evaporation and freezing (when seawater freezes, the resulting ice is mostly fresh water and the salts are excluded, making the remaining water even saltier). So differences in rates of precipitation, evaporation, river discharge, and ice formation play a significant role in regional salinity variations. For example, the Baltic Sea has a very low surface salinity of around 10 ppt, because it is a mostly enclosed body of water with lots of river input. Conversely, the Red Sea is very salty (around 40 ppt), due to the lack of precipitation and the hot environment which leads to high levels of evaporation.
One of the saltiest large bodies of water on Earth is the Dead Sea, between Israel and Jordan. Salinity in the Dead Sea is around 330 ppt, which is almost ten times saltier than the ocean. This extremely high salinity is a result of the hot, arid conditions in the Middle East that lead to high rates of evaporation. In addition, in the 1950s the flow from the Jordan River was diverted away from the Dead Sea, so there is no longer significant fresh water input. With no input and high evaporation, the water level in the Dead Sea is receding at a rate of about 1 m per year. The high salinity makes the water very dense, which creates buoyant forces that allow people to easily float at the surface. But the high salinity also means that the water is too salty for most living organisms, so only microbes are able to call it home; hence the name the Dead Sea. But as salty as the Dead Sea may be, it is not the saltiest body of water on Earth. That distinction currently belongs to Gaet’ale Pond in Ethiopia, with a salinity of 433 ppt!
Latitudinal Variations
While local conditions are important for determining salinity patterns in any single location, there are some global patterns that bear further investigation. Temperature is highest at the equator, and lowest near the poles, so we would expect higher rates of evaporation, and therefore higher salinity, in equatorial regions (Figure 5.3.2). This is generally the case, but in the figure below salinity right along the equator seems to be a little lower than at slightly higher latitudes. This is because equatorial regions also get a high volume of rain on a regular basis, which dilutes the surface water along the equator. So the higher salinities are found at subtropical, warm latitudes with high evaporation and less precipitation. At the poles there is little evaporation, which, coupled with ice and snow melting, produces a relatively low surface salinity. The image below shows high salinity in the Mediterranean Sea; this is located in a warm region with high evaporation, and the sea is largely isolated from mixing with the rest of the North Atlantic water, leading to high salinity. Lower salinities, such as those around southeast Asia, are the result of precipitation and high volumes of river input.

Figure 5.3.3 shows the mean global differences between evaporation and precipitation (evaporation - precipitation). Green colors represent areas where precipitation exceeds evaporation, while brown regions are where evaporation is greater than precipitations. Note the correlation between precipitation, evaporation, and surface salinity as seen in Figure 5.3.2.

Vertical Variation
In addition to geographical variation in salinity, there are also changes in salinity with depth. As we have seen, most differences in salinity are due to variations in evaporation, precipitation, runoff, and ice cover. All of these process occur at the ocean surface, not at depth, so the most pronounced differences in salinity should be found in surface waters. Salinity in deeper water remains relatively uniform, as it is unaffected by these surface processes. Some representative salinity profiles are shown in Figure 5.3.4. At the surface, the top 200 m or so show relatively uniform salinity in what is called the mixed layer. Winds, waves, and surface currents stir up the surface water, causing a great deal of mixing in this layer and fairly uniform salinity conditions. Below the mixed layer is an area of rapid salinity change over a small change in depth. This zone of rapid change is called the halocline, and it represents a transition between the mixed layer and the deep ocean. Below the halocline, salinity may show little variation down to the seafloor, as this region is far removed from the surface processes that impact salinity. In the figure below, note the low surface salinity at high latitudes, and higher surface salinity at low latitudes as discussed above. Yet despite the surface differences, salinity at depth in both locations may be very similar.

Protecting the Marine Environment
Many national, state, and local governments and organizations have been struggling for decades to manage marine pollution and protect coastal environments. In the United States, the National Oceanographic and Atmospheric Administration (NOAA) overseas large portions of the coastal waters around North America, attempting to stop overfishing and restricting coastal development in many regions. Expanding efforts involve protecting coastal wetlands, mitigating coastal hazards, ensuring public coastal access, protecting beaches and coastal park lands, locating of energy and government facilities, and managing sensitive habitats, fishery areas, and aquaculture. Efforts are underway nationwide to prevent and control polluted runoff by replacing outdated storm water runoff and sewage systems, reducing agricultural pollutants, preventing or mitigating development within sensitive habitats and erosion-prone areas, and finding ways for communities to reduce refuse and debris from entering coastal waters.
Focus on Coral Reefs
Coral reefs (or coral ecosystems) are among the most important and also most sensitive habitats throughout the world’s oceans. Reefs provide habitat, spawning and nursery grounds for economically important fish species, and are hotspots of marine biodiversity. For humanity, coral reefs provide billions of dollars in economic and environmental benefits, including fishing, coastal protection, recreation, and tourism. Hundreds of millions of people worldwide depend of reef ecosystems for their livelihoods and food. However, coral ecosystems face serious threats from unsustainable fishing and land-based pollution (Figures 17-30 and 17-31).
Unfortunately, many of the world’s reefs have already been destroyed or severely damaged by pollution, unsustainable fishing practices, disease, introduction of invasive species, ship groundings, uncontrolled coastal development and other impacts.
Human activities are a primary cause for reef destruction. Pollutants from expanding coastal communities find their way to shallow coastal waters dominated by coral reefs, mostly in warm tropical waters. Many of the sea creatures, particularly invertebrates that attach to the seabed and filter seawater. Tourist visiting reefs step on fragile reef structures, introduce chemicals (such as zinc and other compounds in sun screen). Sewage and urban runoff carries silt (increasing turbidity) and introduce toxins that impact or kill reef organisms. Perhaps most alarming are the impacts of changes in water temperature and water chemistry associated with climate change.
Climate Change - The most important environmental issue of our times!
Studies conducted throughout the world’s oceans show the coral ecosystems are showing the detrimental effects of climate change caused by the burning of fossil fuels, deforestation, and bad agricultural practices that release large quantities of greenhouse gases into the atmosphere.
Climate change impacts coral ecosystems by increasing sea-surface temperatures and increased carbon dioxide levels in seawater. Long-term studies of CO2 concentrations in seawater show trends in reducing calcification rates in reef-building and reef-associated organisms. Increased sea surface temperature leads to coral bleaching (a result in the loss of symbiotic algae and bacteria) and death of skeletal reef-building organism. Weakened coral communities are susceptible to infection disease. Pollution from coastal development and agricultural runoff can also impede coral growth and reproduction, disrupt ecological functions, and cause disease.
Coal is the most carbon-intensive fossil fuel, producing the most carbon dioxide per unit volume burned. For every ton of coal burned, approximately 2.5 tons of CO2 is released into the air. Globally, coal is the largest-used fossil fuel source and the highest production of carbon dioxide emissions. Although coal represents only about one-third of share of fossil fuels consumed by the world’s total primary energy supply, coal is responsible for 43% of carbon dioxide emissions from burning fossil fuels.
Politics of Climate Change: Sadly, our world may be in big trouble because of the economics associated with energy and agricultural demands of a growing world population. Failure to address carbon emissions and the resultant impacts of rising temperatures and ocean acidification could make many marine and coastal management efforts futile. While reducing CO2 and other greenhouse gas emissions is vital to stabilize the global climate is essential, the excess that already exists in the atmosphere will persist throughout the next century.
Climate changes will have many impacts on marine systems including reduction in marine biodiversity, sea level is rising, and long-term forecasts predict changes in the frequency, intensity, and distribution of tropical storms as atmospheric and ocean circulation patterns change.
Politics vs. Technology: The key to saving or destroying our natural environments
The climate change issues will be every-increasingly important as the impacts become increasingly obvious as the number of natural and man-made disasters steadily rises. Humans have to collectively choose, through political means, to make the choices to change to cleaner technologies, and protecting and managing resources. The choices to move away from fossil-fuel consumption to alternative energy sources will be expensive and a hard fight because it will impact the livelihoods of many people (such as coal miners and workers in the petroleum industries). Predicted sea-level rise and global warming will impact all world's communities, both human and ecosystems. There will be many winners and losers in the transition to a cleaner, more sustainable world. Accepting the consequences for climate change will create many new jobs in the process. The longer humanity waits to make these changes, the greater the environmental problems will be in the future. "We can't fool mother nature!"
From Miracosta College, is shared under a not declared license and was authored, remixed, and/or curated by LibreTexts. Download this book for free at https://geo.libretexts.org/Bookshelves/Oceanography/Oceanography_101_(Miracosta)
Large marine disasters involving petroleum spills have happened many times over the past century. The impact of these events depends on where and how they occur. Some are accidents, others include intentional acts of war, such as the destruction of Kuwait’s oil fields in the First Gulf War. Oil spills can have a wide variety of impacts ranging from minimal (when far from coastal regions) to catastrophic when they impact shore regions. Two of the largest (most expensive) petroleum-related disasters affecting North American coastal waters are discussed below.
The Deepwater Horizon Disaster, 2010
The Deepwater Horizon Disaster started on April 20, 2010 with an explosion and fire of a submersible drilling platform located in the Gulf of Mexico about 40 miles (64 km) offshore from the Louisiana coast. The drilling operation involved tapping an oil reservoir deep in sedimentary deposits on the offshore region beyond the continental shelf. Problems with the drilling operation and failure of equipment to prevent a blowout that resulted in the explosion and fire, and the eventual sinking of the drilling platform two days later. 17 platform workers were killed and another 11 were injured by the explosion and fire. The open well, sheared of at the seabed, proceeded to spew large quantities of crude oil into Gulf waters until it was shut down in mid July when a 75 ton cap was put in place, sealing off the well. The disaster resulted in the largest oil spill in the history of the Petroleum Industry.
An estimated 200 million gallons (about 5 million barrels) of oil poured into ocean from the unconstrained well. Some of oil stayed on or near the seabed, much of it formed a large plum in layers within the ocean waters, and some migrated to the surface where wind and currents dispersed it. An extensive cleanup effort was undertaken to trap, degrade and disperse, or burn off much of the oil on the surface. Unfortunately, large amounts found its way onshore, impacting beaches and coastal wetlands, and severely impacting wildlife. The bad publicity wreaked economic havoc on coastal communities and businesses involved in fishing and recreation from Texas to Florida. As of 2015, BP (the company that operated the drilling program) agreed to pay $18.7 billion to settle all federal and state claims for the disaster - the biggest pollution penalty in U.S. history. Total settlement costs was in the range of $54 billion.
Settlement of all federal and state claims brings total costs to nearly $54 billion. BP PLC agreed to pay $18.7 billion to settle all federal and state claims arising from the 2010 Deepwater Horizon oil spill, including the biggest pollution penalty in U.S. history.
Because the spill happened in the warm open ocean waters, much of the crude oil from the spill eventually dispersed (evaporated or diluted) or was consumed by microbial activity.
 |
||
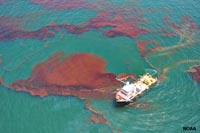
| Figure 12.10.2. An oil slick spreads on the Gulf of Mexico from the Deep Horizon disaster. |
Exxon Valdez Oil Spill Disaster, 1989
Prior to the Deepwater Horizon disaster, the worst petroleum-related disaster affecting the US coastline was the Exxon Valdez oil spill (Figures 17-24 and 17-25). The oil spill occurred in Prince William Sound in the Gulf of Alaska. The Exxon Valdez, a large oil tanker bound for refineries in Long Beach, California, veered off course and struck a submerged rock “reef” outcrop on March 24, 1989. The disaster was blamed on poor navigation by a drunken ship captain, poorly trained personnel, and faulty and unused navigation equipment.
Estimates by governmental and other sources suggest that at least 10 to 11 million gallons (about 250,000 barrels) of Alaskan crude oil spilled into the coastal waters. The spill, so close to shore, eventually impaction about 1,300 miles (2,000 km) of coastline in the Gulf of Alaska (closer to 9,000 miles [14,500 km] considering all the islands, headlands, and bays along the rugged coastline). Rough seas, and the rugged and remote coastline made clean-up efforts extremely difficult, and the cold-water setting hampered the rapid decay and dispersion of the oil. The spill devastated habitats for salmon, seals, seabirds, and sea otters, and had a catastrophic effect of coastal communities in the region. The cost of the disaster, spread over many years, was in the range of about $7 billion. Hard facts were learned from the disaster. It turns out that some of the beach areas were "cleaned" - basically cooked with 150 F water. These areas were actually harmed more by the cleaning processes used. It was determined that about 35% of the oil evaporated, 8% burned, 5% dispersed by surf , and only about 5% biodegraded; the rest formed slicks that dispersed into the greater ocean currents offshore.
An outcome of the disaster is that all new large petroleum-transport vessels are now being built with double hulls to hopefully prevent future transport-spill disasters.
Impact of Petroleum Pollution on Wildlife
Pollution from petroleum-source products is a major problem in parts of the worlds oceans and coastlines. In addition, tar-ball, waxes, and other petroleum-derivative products can now be found throughout the world’s oceans. Evidence of the pollution is most abundant along developed (urban and industrial) coastlines where accidental spills occur most frequently. The risks of spills occur along all infrastructure systems associated with the petroleum production, refining, transportation, and consumption. Leaky oil from cars and trucks are a major non-point source of water pollution. Large oil spills and oil production disasters are some of the most costly, devastating both wildlife and the economic livelihoods of communities in regions where they occur (Figure 17.26).
Oil spills are particularly bad for homeothermic (warm blooded) organisms with fur of feathers. Saturation with oil causes these animals to loose insulation and they die from hypothermia. Oil slicks poison kill 150-450,000 sea birds killed each year. Organisms living in the intertidal zone most sensitive to oil contamination.
Refined oil and oil-derivative products tend to be non-biodegradable, and are more toxic to wildlife.
From Miracosta College, is shared under a not declared license and was authored, remixed, and/or curated by LibreTexts. Download this book for free at https://geo.libretexts.org/Bookshelves/Oceanography/Oceanography_101_(Miracosta)

Suborder Pinnipedia: seals, sea lions and walruses
- As a group, they are fairly young, having been around for only about 25 million years
- They consist of three families:
- Otariidae: sea lions
- Phocidae: true seals
- Odobenidae: walruses
Otariidae (sea lions) have:
- small, but obvious external ears
- long, flexible necks
- independent and mobile hind limbs that permit substantial movement on land
- nostrils that are located at the tip of the snout
- a dense and soft undercoat of fur protected by a layer of long and close guard hairs
- several layers of blubber for thermal protection
Phocidae (true seals) differ from sea lions in that they have:
- no external ears
- smooth, coarse hair with no underfur
- a hind limb geometry that restricts their ability to move on land
- fore flippers that are smaller than those of sea lions
Diving behavior and adaptations:
- can shut off their nostrils completely while diving
- can restrict the flow of blood to vital organs
- can store lots of oxygen
- routinely dive for 30 minutes
Odobenidae (Walruses):
- These creatures are limited to the Arctic waters of the Atlantic and Pacific
- Their hind limbs are similar to those of sea lions, but they have no external ear
- The most characteristic feature is the set of enlarged canine teeth – tusks
- They may weigh up to 4000 pounds
- They have air sacs in their cheeks that are used for support like a life preserver because they sleep in the water
- They also use their tusks to hoist themselves out of the water onto the ice
- They are becoming rare; estimates of their numbers world-wide are around 170,000 to 190,000 individuals
Suborder Fissipedia: sea otters
- These members of the weasel family are included in the list of marine mammals because they do live in the sea and are obviously mammals
- They have the distinction of having the most valuable fur of any animal – their dark brown underfur is extraordinarily dense and rich
- Trade in sea otter fur dates back at least to 1786, under the Spanish
- This became the most important industry of the California coast and most otters were gone by 1850
- In 1900, a small population was discovered near Bixby Creek on the central California coast
- Today, the otter's range has expanded along much of the Pacific coast of the U.S., especially since their protection under the Marine Mammal Protection Act of 1972
- They grow to lengths of about 5 ft and weights up to about 80 pounds
- They live for up to about 20 years
- They live by foraging for urchins, abalone, mussels, clams, crabs and other tidbits in relatively shallow water, rarely diving deeper than 60 ft
- They frequently consume their food in an attitude of leisure as they float gently on their backs
- They will use stones to smash open shellfish by placing them on their stomachs as they float on their backs
- They have very high metabolic rates and must consume up to 25% of their body weight each day in order to maintain an internal temperature of 100 degrees
- This works out to be about 140 to 190 calories per kilogram of body weight per day, compared to the average human who must consume about 32 calories per kilogram of body weight per day
- If a sea otter doesn't eat for a day, it will lose up to 10% of its body weight
- They live in the kelp forests and use the kelp as a tether while resting at the surface
- They help protect the kelp forest by eating the sea urchins that feed on the kelp
- They also use the kelp as protection from their enemies, including sharks and killer whales
- Making them a keystone species in this habitat
Order Sirenia: sea cows
- This group includes the manatees, which are found in the shallow bays and estuaries of North America and Africa, and the dugongs, which are found in the Indo-Pacific regions
- They're common in the winter in the warm-springs of Florida's west coast including the Crystal River
- These lovable rascals feed on water plants (especially the hyacinths in southern canals) – they're strictly vegetarians
- They show little fear of man and, as a result, many are killed or severely injured each year by boat propellers, as they have a habit of swimming just below the surface
- They form family groups and appear to show great care and affection for family members
The Sirenians were named after the Sirens, the mermaids that Ulysses encountered on his return from the Trojan wars – apparently they resembled mermaids to sailors who had been too long at sea or were drunk (or maybe both)...
In the images below, can you tell which is the real mermaid?
Written by Dr. Cristina Cardona.
Our modern understanding of tide formation stems from Isaac Newton's Law of Universal Gravitation, which states that any two objects have a gravitational attraction to each other. The magnitude of the force is proportional to the masses of the objects, and inversely proportional to the square of the distance between the objects, according to the equation in Figure 3.5.1.
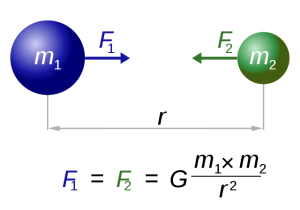
In the case of tides, there are a few other factors that modify this equation so that the distance (r) is cubed rather than squared, giving distance an even greater impact on tidal forces. But for our purposes, the important lesson is that the greater the masses of the objects, the greater the gravitational force, and the farther the objects are from each other, the weaker the force.
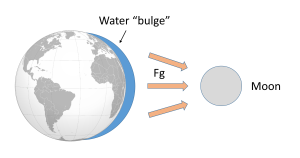
Such a gravitational force exists between the Earth and moon, attempting to pull them towards each other. Since the water covering Earth is fluid (unlike the solid land that is more resistant to tidal forces), this gravitational force pulls water towards the moon, creating a "bulge" of water on the side of the Earth facing the moon (Figure 3.5.2). This bulge always faces the moon, while the Earth rotates through it; the regions of Earth moving through the bulge experience a high tide, while those parts of the Earth away from the bulge experience a low tide.
If the tides were this simple, everywhere on Earth would see one high tide per day, as there would only be a bulge of water on the side closest to the moon. However, if you have ever looked at tide charts, or lived near the ocean, you probably know that in most places there are two high tides and two low tides per day. Where is this second high tide "bulge" coming from?
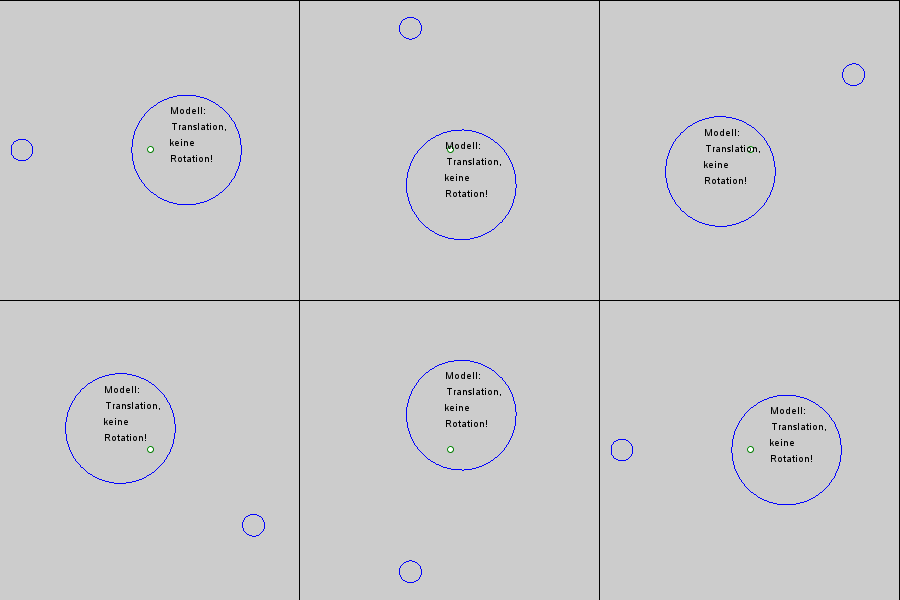
The gravitational force between the Earth and moon might be expected to draw the two objects closer together, however, this is not happening. This is because the inward gravitational force is opposed by outward forces that keep the Earth and moon apart. The outward force is an intertial force created by the rotation of the Earth and moon. Contrary to popular belief, the moon is not simply rotating around the Earth; in fact, the Earth and moon are both rotating around each other. Imagine the Earth and moon as equal-sized objects revolving around a point at their center of mass. If both objects had the same mass, the center of rotation would be a point equidistant between the two objects. But since the mass of the Earth is 82 times greater than the mass of the moon, the center of revolution must be closer to the Earth. As an analogy, think about two people on a see-saw. If the people are of roughly equal size, they can sit on either end of the see-saw at it will rotate around a point at equal distance between them. But if the two people have very different masses, such as a large adult and a small child, the larger person must move closer to the pivot point for the see-saw to rotate effectively. In the same way, the center of rotation between the Earth and the moon (the barycenter) must be located closer to the Earth. In fact, the center of rotation lies within the Earth, about 1600 km below the surface. As the Earth and moon rotate around the barycenter, the moon travels much farther than the Earth, giving the impression that the moon is rotating around Earth (Figure 3.5.3).
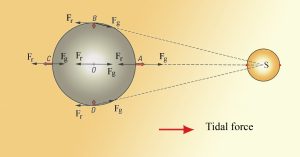
The rotation of the Earth-moon system creates an outward inertial force, which balances the gravitational force to keep the two bodies in their orbits. The inertial force has the same magnitude everywhere on Earth, and is always directed away from the moon. Gravitational force, on the other hand, is always directed towards the moon, and is stronger on the side of the Earth closest to the moon. Figure 3.5.4 describes how these forces combine to create the tidal forces. At point O in the center of the Earth, the gravitational force (Fg) and the inertial force (Fr) are equal, and cancel each other out. On the side of Earth closest to the moon, the inward gravitational force (Fg) is greater than the outward inertial force (Fr); the net resulting force (A) is directed towards the moon, and creates a bulge of water on the side facing the moon. On the side of Earth opposite the moon, the outward inertial force is greater than the inward gravitational force; the net resulting force (C) is directed away from the moon, creating a water bulge directed away from the moon.
Now, as the Earth rotates through a 24 hour day, each region passes through two bulges, and experiences two high tides and two low tides per day. This represents Newton's Equilibrium Theory of Tides, where there are two high tides and two low tides per day, of similar heights, each six hours apart. But as with everything else in oceanography, reality is much more complex than this idealized situation.
Some of the additional complexity is because in addition to the moon, the sun also exerts tide-affecting forces on Earth. The solar gravitational and inertial forces arise for the same reasons described above for the moon, but the magnitudes of the forces are different. The sun is 27 million times more massive than the moon, but it is 387 times farther away from the Earth. Despite its larger mass, because the sun is so much farther away than the moon, the sun's gravitational forces are only about half as strong as the moon's (remember that distance is cubed in the gravity equation). The sun thus creates its own, smaller water bulges, independent of the moon's, that contribute to the creation of tides.
When the sun, Earth and moon are aligned, as occurs during new and full moons, the solar and lunar bulges are also aligned, and add to each other (constructive interference; see section 4.2) creating an especially high tidal range; high high tides and low low tides (Figure 3.5.5). This period of maximum tidal range is called a spring tide, and they occur every two weeks.

When the sun, Earth and moon are at 90o to each other, the solar and lunar bulges are out of phase, and cancel each other out (destructive interference). Now the tidal range is small, with low high tides and high low tides (Figure 3.5.6). These are neap tides, and occur every two weeks, when the moon is in its 1/4 and 3/4 phases (Figure 3.5.7).


By Paul Webb, used under a CC-BY 4.0 international license. Download this book for free at https://rwu.pressbooks.pub/webboceanography/front-matter/preface/
A whole new ecosystem reliant on the processes of plate tectonics was discovered on the deep seafloor of the Galapagos Rift in 1977. The deep sea submersible Alvin was exploring in 2500 m of water when it encountered unusually warm water. Following the temperature gradient, Alvin eventually discovered jets of superheated water coming from out of the seafloor at temperatures up to 350o C (the normal temperature for water at this depth would be 2-4o C). The water poured out of cracks in the crust, as well as through tall chimneys up to 20 m high and 1 m wide, and as it emerged it took on the appearance of thick black smoke, These fissures were named hydrothermal vents, and the chimneys "black smokers".
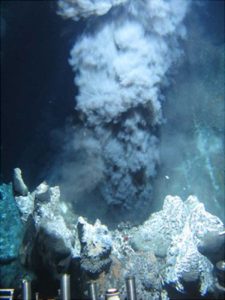
To create these vents, water percolates into the crust where there are plumes of magma close to the surface. The water gets superheated by the magma, then moves back to the surface through convection and is released through the vents. The hot water dissolves minerals from the surrounding rock, and as the water emerges and cools, the dissolved minerals and inorganic sulfides precipitate out as small particles and turn the water black, leading to the black "smoke" coming from the vents. Precipitation of these minerals also create the tall chimneys characteristic of many hydrothermal vents.
Since their original discovery in the Galapagos Rift, hydrothermal vents have been located across the globe along oceanic ridges where there is shallow crust and a lot of tectonic activity (Figure 2.11.2).

Figure 2.11.2 Distribution of hydrothermal vents (red dots) and their association with plate boundaries (By DeDuijn (Own work) [CC BY-SA 4.0], via Wikimedia Commons).
As unexpected as it was to discover these vent systems, even more surprising was the fact that they were teeming with life. The vents are surrounded by a diverse range of previously unknown organisms, including giant tube worms over 2 m long, crabs, shrimp, giant mussels, and mats of bacteria. How is it that such a diverse community can exist in the ocean depths, far removed from the sunlight that supports photosynthesis and primary production in most other ecosystems? The answer is that the water exiting the vents is rich in hydrogen sulfide (H2S), oxygen and CO2. The bacteria surrounding the vents use energy from the oxidation of sulfur compounds like H2S to form carbohydrates from CO2 and water. This is the process of chemosynthesis, and the bacteria are very productive as these reactions occur faster at high temperatures. The bacteria then represent the base of the food web, as other organisms eat the bacteria, or derive their energy from bacteria living symbiotically within their tissues. Watch the video below for more about hydrothermal vents.
https://www.youtube.com/watch?v=UVzBjY8oLkk
The ocean is also home to a variety of birds. These birds are referred to as seabirds because they spend a considerable amount of time around the sea. Many seabirds spend their entire lives in the ocean, only coming to land to reproduce. Some seabirds dive and swim below the surface, such as penguins, whose wings are modified into flippers, or cormorants, whose webbed feet act as paddles. Others stay at the surface, only hunting in the uppermost meter of the water (Keddy). Please go to this website to read more about seabirds: https://ca.audubon.org/what-s-seabird
Birds evolved from reptilian ancestors
Birds split from the main reptile branch about 150 million years ago with an intermediate form known as Archaeopteryx, which was about the size of a crow. They have reptilian characteristics, such as their feet and lower legs are covered with scales and terminate in claws, their reproductive physiology is basically reptilian (laying eggs out of water), their feathers are believed to have been derived from scales, and have many other developmental and structural similarities with reptiles. Yet, unlike reptiles, birds are warm-blooded (endothermic) and maintain a constant internal body temperature.
Marine birds
Marine birds tend to be larger and stronger than their land counterparts. They have a lightweight, low-density body structure with hollow bones. Their wings are long, pointed and cupped underneath to support a large and muscular organism aloft for long periods of time.
They do not drink freshwater. Instead, they have salt glands over their eyes that remove the salt, thus permitting them to drink seawater, freeing them from dependence on freshwater from the land. The salty fluid is expelled through their bills.
The albatross
- This is one of the largest of the oceanic birds, with a wingspan of up to 12 feet
- They are the best gliders in the world – may remain aloft for months at a time, taking advantage of the west wind drift (winds that blow completely around Antarctica)
Pelicans
- This prehistoric-looking bird feeds by diving on its prey and entrapping it in its large gular pouch
- It has air sacs in its shoulders that absorb the impact with the water
Arctic Terns
- This bird feeds on small fish swimming near the surface that it catches by diving. It may even swim below the surface after them
- It lives at high latitudes and breeds on all far north rocky coasts
- However, it dislikes cold weather, so makes the longest migration of any animal, 15,000 miles each way
Penguins
- Penguins are found only in the southern hemisphere
- They are flightless birds that "fly" through the water after fish, squid and krill
- They slow their heart rate
- Have subcutaneous fat layers for insulation
- Have heavy plumage for insulation
- Their bodies are streamlined
- They have heavy feet for paddling and kicking against the water
- Their blood is shunted to the heart and brain and the extremities are deprived of blood, in order to slow heat loss
- These apply to most diving birds
Emperor Penguin: These are the largest diving birds in the world, up to 4 ft in height
- They're the best bird divers in the world, can routinely dive for 5-10 minutes (most bird dives last 30 seconds to a minute) and at best can stay down for 15-18 minutes, diving to over 1000 feet
- They eat small fish and krill – penguin populations have increased as a result of the killing off of the great whales – more krill is available as food for penguins
Penguin Adaptations
- They fluff their feathers to create trapped air in a dead space
- They have long feathers
- They rock back and forth on their heels on the ice to limit the area in contact with the ice and slow heat loss
- They can reduce blood flow to and heat loss from their wings and feet
- They exhibit "huddle" behavior – gathering in large groups and constantly changing position so that each gets a turn in the center, where it's warmest
The first paragraph, by Keddy (University of California, Davis), is shared under a not declared license and was authored, remixed, and/or curated by LibreTexts. Download this book for free at https://geo.libretexts.org/Courses/Diablo_Valley_College/OCEAN-101%3A_Fundamentals_of_Oceanography_(Keddy)
The rest was written by Dr. Cristina Cardona.
Our modern understanding of tide formation stems from Isaac Newton's Law of Universal Gravitation, which states that any two objects have a gravitational attraction to each other. The magnitude of the force is proportional to the masses of the objects, and inversely proportional to the square of the distance between the objects, according to the equation in Figure 3.5.1.

In the case of tides, there are a few other factors that modify this equation so that the distance (r) is cubed rather than squared, giving distance an even greater impact on tidal forces. But for our purposes, the important lesson is that the greater the masses of the objects, the greater the gravitational force, and the farther the objects are from each other, the weaker the force.
Such a gravitational force exists between the Earth and moon, attempting to pull them towards each other. Since the water covering Earth is fluid (unlike the solid land that is more resistant to tidal forces), this gravitational force pulls water towards the moon, creating a "bulge" of water on the side of the Earth facing the moon (Figure 3.5.2). This bulge always faces the moon, while the Earth rotates through it; the regions of Earth moving through the bulge experience a high tide, while those parts of the Earth away from the bulge experience a low tide.

If the tides were this simple, everywhere on Earth would see one high tide per day, as there would only be a bulge of water on the side closest to the moon. However, if you have ever looked at tide charts, or lived near the ocean, you probably know that in most places there are two high tides and two low tides per day. Where is this second high tide "bulge" coming from?
The gravitational force between the Earth and moon might be expected to draw the two objects closer together, however, this is not happening. This is because the inward gravitational force is opposed by outward forces that keep the Earth and moon apart. The outward force is an intertial force created by the rotation of the Earth and moon. Contrary to popular belief, the moon is not simply rotating around the Earth; in fact, the Earth and moon are both rotating around each other. Imagine the Earth and moon as equal-sized objects revolving around a point at their center of mass. If both objects had the same mass, the center of rotation would be a point equidistant between the two objects. But since the mass of the Earth is 82 times greater than the mass of the moon, the center of revolution must be closer to the Earth. As an analogy, think about two people on a see-saw. If the people are of roughly equal size, they can sit on either end of the see-saw at it will rotate around a point at equal distance between them. But if the two people have very different masses, such as a large adult and a small child, the larger person must move closer to the pivot point for the see-saw to rotate effectively. In the same way, the center of rotation between the Earth and the moon (the barycenter) must be located closer to the Earth. In fact, the center of rotation lies within the Earth, about 1600 km below the surface. As the Earth and moon rotate around the barycenter, the moon travels much farther than the Earth, giving the impression that the moon is rotating around Earth (Figure 3.5.3).

The rotation of the Earth-moon system creates an outward inertial force, which balances the gravitational force to keep the two bodies in their orbits. The inertial force has the same magnitude everywhere on Earth, and is always directed away from the moon. Gravitational force, on the other hand, is always directed towards the moon, and is stronger on the side of the Earth closest to the moon. Figure 3.5.4 describes how these forces combine to create the tidal forces. At point O in the center of the Earth, the gravitational force (Fg) and the inertial force (Fr) are equal, and cancel each other out. On the side of Earth closest to the moon, the inward gravitational force (Fg) is greater than the outward inertial force (Fr); the net resulting force (A) is directed towards the moon, and creates a bulge of water on the side facing the moon. On the side of Earth opposite the moon, the outward inertial force is greater than the inward gravitational force; the net resulting force (C) is directed away from the moon, creating a water bulge directed away from the moon.
Now, as the Earth rotates through a 24 hour day, each region passes through two bulges, and experiences two high tides and two low tides per day. This represents Newton's Equilibrium Theory of Tides, where there are two high tides and two low tides per day, of similar heights, each six hours apart. But as with everything else in oceanography, reality is much more complex than this idealized situation.

Some of the additional complexity is because in addition to the moon, the sun also exerts tide-affecting forces on Earth. The solar gravitational and inertial forces arise for the same reasons described above for the moon, but the magnitudes of the forces are different. The sun is 27 million times more massive than the moon, but it is 387 times farther away from the Earth. Despite its larger mass, because the sun is so much farther away than the moon, the sun's gravitational forces are only about half as strong as the moon's (remember that distance is cubed in the gravity equation). The sun thus creates its own, smaller water bulges, independent of the moon's, that contribute to the creation of tides.
When the sun, Earth and moon are aligned, as occurs during new and full moons, the solar and lunar bulges are also aligned, and add to each other (constructive interference; see section 4.2) creating an especially high tidal range; high high tides and low low tides (Figure 3.5.5). This period of maximum tidal range is called a spring tide, and they occur every two weeks.

When the sun, Earth and moon are at 90o to each other, the solar and lunar bulges are out of phase, and cancel each other out (destructive interference). Now the tidal range is small, with low high tides and high low tides (Figure 3.5.6). These are neap tides, and occur every two weeks, when the moon is in its 1/4 and 3/4 phases (Figure 3.5.7).


By Paul Webb, used under a CC-BY 4.0 international license. Download this book for free at https://rwu.pressbooks.pub/webboceanography/front-matter/preface/


